


Market By Type, Cable Type, Material, Application And Geography | Forecast 2019-2027
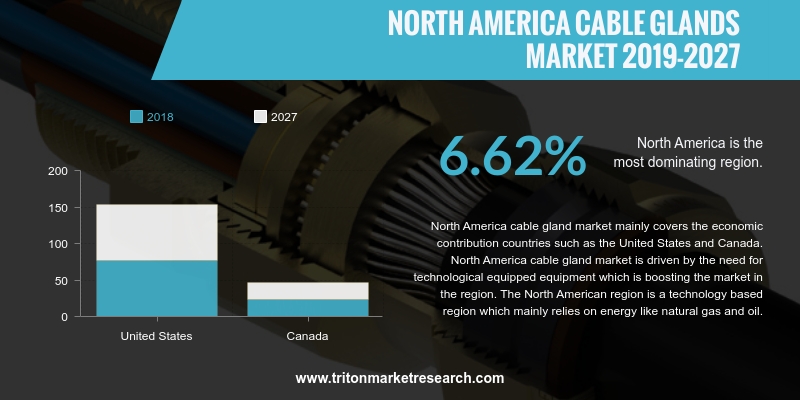
Triton Market Research, in its report, has concluded that the North American cable glands market is set to grow with a CAGR of 6.62% in the forecasting years of 2019-2027.
The countries analyzed in the report on the North America market for cable glands are:
• The United States
• Canada
The demand for technologically advanced equipment is boosting the demand for cable glands in North America, thereby driving the market growth in the region. North American is a technology-based region mainly relying on energy like oil & natural gas. The rise in population has led to an increase in demand for energy and infrastructure, thus propelling the region’s construction industry during the forecasted years. Heavy investments in the commercial & residential sector have resulted in an increase in the cash flow into the economy. This has boosted the demand for the cable glands in the region, thereby leading to the growth of North America’s cable glands market.
Report Scope Can Be Customized Per Your Requirements. Request for Customization
The ancient construction present in the United States, coupled with enhanced usage of electrical devices & energy, have necessitated the implementation of new cable connections and the installation of high-tech connections in the country. This factor is driving the growth of the US market for cable glands.
Amphenol Corporation is one of the leading companies in the world dealing with interconnect products. It is engaged in designing, manufacturing and marketing of interconnecting systems; electrical, electronic & fiber optic connectors; antennas; coaxial and high-speed specialty cables; and sensors & sensor-based products. Amphenol, Socapex, Kai Jack, Tuchel, Spectra-Strip, Sine, Matrix, Pyle-National and Times Fiber are some of the brands under which the company markets its products. Amphenol caters to various industries, such as IT, automotive, and defense & aerospace, among others. The US-based company is headquartered in Wallingford, Connecticut. In March 2019, Amphenol launched its new plastic cable gland called ‘Durometer AHDP’; the launch of new products by the company is expected to boost its growth.

Market Segmented By Type, Appl ..
VIEW REPORT
Market By Raw Material, End-us ..
VIEW REPORT
Market by Type, Raw Material, ..
VIEW REPORT
Market by Technology, Type, En ..
VIEW REPORT
Market by Function, Product Ty ..
VIEW REPORT
Market by Product Type, Applic ..
VIEW REPORT
Market by Product, Industry Ve ..
VIEW REPORT
Market by Type, Material, Indu ..
VIEW REPORT1. NORTH
AMERICA CABLE GLANDS MARKET – SUMMARY
2. INDUSTRY
OUTLOOK
2.1. MARKET
DEFINITION
2.2. KEY
INSIGHTS
2.2.1. RISING
DEMAND FOR HAZARDOUS CABLE GLANDS
2.2.2. SWELLING
DEMAND FOR CABLE CONNECTORS IN THE AEROSPACE SECTOR
2.3. PORTER’S
FIVE FORCES ANALYSIS
2.3.1. THREAT
OF NEW ENTRANTS
2.3.2. THREAT
OF SUBSTITUTE
2.3.3. BARGAINING
POWER OF SUPPLIERS
2.3.4. BARGAINING
POWER OF BUYERS
2.3.5. THREAT
OF COMPETITIVE RIVALRY
2.4. KEY
IMPACT ANALYSIS
2.4.1. COST
2.4.2. SCALABILITY
2.4.3. EASE
OF USE
2.5. MARKET
ATTRACTIVENESS INDEX
2.6. VENDOR
SCORECARD
2.7. MARKET
DRIVERS
2.7.1. GOVERNMENT
REGULATIONS FUEL THE DEMAND FOR CABLE GLANDS
2.7.2. RESTORATION
OF ELECTRICAL NETWORKS IN SEVERAL REGIONS
2.7.3. RISE
IN CONSTRUCTION UNDERTAKINGS IN DEVELOPING REGIONS
2.7.4. WIDE
ADOPTION OF AUTOMATION
2.8. MARKET
RESTRAINTS
2.8.1. VARIABILITY
IN RAW MATERIAL PRICES
2.9. MARKET
OPPORTUNITIES
2.9.1. EMERGING
GROWTH IN BUDDING MARKETS
2.9.2. SURGE
IN COUNT OF DATA CENTERS
2.10. MARKET
CHALLENGES
2.10.1.
SUSPENSION OF THE LOCAL
MARKETS
3. NORTH
AMERICA CABLE GLANDS MARKET OUTLOOK – BY TYPE
3.1. INDUSTRIAL
3.2. HAZARDOUS
3.2.1. INCREASED
SAFETY
3.2.2. FLAME-PROOF
3.2.3. EMC
CABLE GLANDS
3.2.4. OTHERS
4. NORTH
AMERICA CABLE GLANDS MARKET OUTLOOK – BY CABLE TYPE
4.1. ARMORED
4.2. UNARMORED
5. NORTH
AMERICA CABLE GLANDS MARKET OUTLOOK – BY MATERIAL
5.1. BRASS
5.2. STAINLESS
STEEL
5.3. PLASTIC/NYLON
5.4. OTHERS
6. NORTH
AMERICA CABLE GLANDS MARKET OUTLOOK – BY APPLICATION
6.1. OIL
& GAS
6.2. MINING
6.3. AEROSPACE
6.4. MANUFACTURING
& PROCESSING
6.5. CHEMICAL
6.6. OTHERS
7. NORTH
AMERICA CABLE GLANDS MARKET – REGIONAL OUTLOOK
7.1. NORTH
AMERICA
7.1.1. UNITED
STATES
7.1.2. CANADA
8. COMPETITIVE
LANDSCAPE
8.1. ABB
LTD.
8.2. AMPHENOL
CORPORATION
8.3. EATON
CORPORATION
8.4. EMERSON
ELECTRIC CO.
8.5. HUBBEL INCORPORATED
8.6. THOMAS
& BETTS
8.7. CMP
PRODUCTS
8.8. CORTEM S.p.A
8.9. BARTEC
8.10. JACOB
GMBH
8.11. SEALCON
LLC
8.12. R.
STAHL AG
9. METHODOLOGY
& SCOPE
9.1. RESEARCH
SCOPE
9.2. SOURCES
OF DATA
9.3. RESEARCH
METHODOLOGY
TABLE 1: NORTH AMERICA
CABLE GLANDS MARKET, BY COUNTRY, 2019-2027 (IN $ MILLION)
TABLE 2: MARKET
ATTRACTIVENESS INDEX
TABLE 3: VENDOR
SCORECARD
TABLE 4: NORTH AMERICA
CABLE GLANDS MARKET, BY TYPE, 2019-2027 (IN $ MILLION)
TABLE 5: NORTH AMERICA
CABLE GLANDS MARKET, BY HAZARDOUS, 2019-2027 (IN $ MILLION)
TABLE 6: NORTH AMERICA
CABLE GLANDS MARKET, BY CABLE TYPE, 2019-2027 (IN $ MILLION)
TABLE 7: NORTH AMERICA
CABLE GLANDS MARKET, BY MATERIAL, 2019-2027 (IN $ MILLION)
TABLE 8: NORTH AMERICA
CABLE GLANDS MARKET, BY APPLICATION, 2019-2027 (IN $ MILLION)
TABLE 9: NORTH AMERICA
CABLE GLANDS MARKET, BY COUNTRY, 2019-2027 (IN $ MILLION)
FIGURE 1: NORTH AMERICA
CABLE GLANDS MARKET, BY TYPE, 2018 & 2027 (IN %)
FIGURE 2: PORTER’S FIVE
FORCE ANALYSIS
FIGURE 3: KEY BUYING
IMPACT ANALYSIS
FIGURE 4: NORTH AMERICA
CABLE GLANDS MARKET, BY INDUSTRIAL, 2019-2027 (IN $ MILLION)
FIGURE 5: NORTH AMERICA
CABLE GLANDS MARKET, BY HAZARDOUS, 2019-2027 (IN $ MILLION)
FIGURE 6: NORTH AMERICA
CABLE GLANDS MARKET, BY INCREASED SAFETY, 2019-2027 (IN $ MILLION)
FIGURE 7: NORTH AMERICA
CABLE GLANDS MARKET, BY FLAME-PROOF, 2019-2027 (IN $ MILLION)
FIGURE 8: NORTH AMERICA
CABLE GLANDS MARKET, BY EMC CABLE GLANDS, 2019-2027 (IN $ MILLION)
FIGURE 9: NORTH AMERICA
CABLE GLANDS MARKET, BY OTHERS, 2019-2027 (IN $ MILLION)
FIGURE 10: NORTH
AMERICA CABLE GLANDS MARKET, BY ARMORED, 2019-2027 (IN $ MILLION)
FIGURE 11: NORTH
AMERICA CABLE GLANDS MARKET, BY UNARMORED, 2019-2027 (IN $ MILLION)
FIGURE 12: NORTH
AMERICA CABLE GLANDS MARKET, BY BRASS, 2019-2027 (IN $ MILLION)
FIGURE 13: NORTH
AMERICA CABLE GLANDS MARKET, BY STAINLESS STEEL, 2019-2027 (IN $ MILLION)
FIGURE 14: NORTH
AMERICA CABLE GLANDS MARKET, BY PLASTIC/NYLON, 2019-2027 (IN $ MILLION)
FIGURE 15: NORTH
AMERICA CABLE GLANDS MARKET, BY OTHERS, 2019-2027 (IN $ MILLION)
FIGURE 16: NORTH
AMERICA CABLE GLANDS MARKET, BY OIL & GAS, 2019-2027 (IN $ MILLION)
FIGURE 17: NORTH
AMERICA CABLE GLANDS MARKET, BY MINING, 2019-2027 (IN $ MILLION)
FIGURE 18: NORTH
AMERICA CABLE GLANDS MARKET, BY AEROSPACE, 2019-2027 (IN $ MILLION)
FIGURE 19: NORTH
AMERICA CABLE GLANDS MARKET, BY MANUFACTURING & PROCESSING, 2019-2027 (IN $
MILLION)
FIGURE 20: NORTH
AMERICA CABLE GLANDS MARKET, BY CHEMICAL, 2019-2027 (IN $ MILLION)
FIGURE 21: NORTH
AMERICA CABLE GLANDS MARKET, BY OTHERS, 2019-2027 (IN $ MILLION)
FIGURE 22: NORTH
AMERICA CABLE GLANDS MARKET, REGIONAL OUTLOOK, 2018 & 2027 (IN %)
FIGURE 23: UNITED
STATES CABLE GLANDS MARKET, 2019-2027 (IN $ MILLION)
FIGURE 24: CANADA CABLE
GLANDS MARKET, 2019-2027 (IN $ MILLION)