

Market By End-user, Derivatives And Geography | Forecast 2019-2027
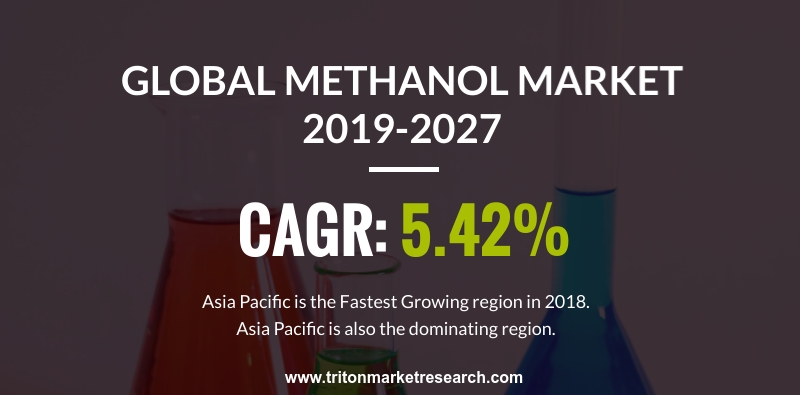
After a detailed analysis, Triton Market Research has concluded that the global methanol market is expected to display an upward trend and is estimated to grow at a CAGR of 5.42% in terms of revenue over the forecast period from 2019 to 2027. The market was assessed to be worth $34547 million in the year 2018 and is predicted to generate a revenue of approximately $56151 million by the year 2027.

Report scope can be customized per your requirements. Request For Customization
Methanol is also known by the names wood alcohol, methyl alcohol and wood spirit. It includes a methyl group (CH3) linked with a hydroxyl group (OH). It’s the simplest form of a long series of organic compounds known as alcohols. Methanol used to be manufactured by the destructive distillation of wood. Today, natural gas, used in the manufacturing of methanol, is being replaced by coal. An alternative method of manufacturing methanol is by solid biomass such as agricultural and industrial waste, in place of syngas.
Within this report from Triton on the methanol market, the market definition and the key insights regarding the industry have been discussed. Also, the market attractiveness matrix, vendor scorecard and Porter’s five force analysis have been studied for the methanol industry.
Market drivers like the rising acceptance of the MTO technology, rise in the demand for petrochemicals, need for conventional transportation fuels and the promotion of methanol as an alternative fuel by the government are fueling the growth of the methanol market. However, the industry is facing restraints like the scarcity of raw materials and the use of fuel grade ethanol or bioethanol instead of methanol which are obstructing the market growth.
Key opportunities like the increase in the demand for bio-based products, the development in technology for biorefining and the application of methanol as a marine fuel can be leveraged by the industry to get towards the projected growth.
Challenges such as the unstable methanol prices, economic slowdown which is hindering the demand for methanol and the regulations & policies are being faced by the industry at this moment.

To get detailed insights on segments, Download Sample Report
Geographies covered for global methanol market are:
• North America: the United States and Canada
• Europe: the United Kingdom, Germany, France, Italy, Spain, the Netherlands, Russia and Rest of Europe
• Asia-Pacific: China, Japan, India, South Korea, Malaysia & Indonesia, Australia & New Zealand and Rest of Asia-Pacific
• Latin America: Brazil, Mexico and Rest of Latin America
• The Middle East and Africa: the United Arab Emirates, Turkey, Saudi Arabia, South Africa and Rest of the Middle East and Africa.
The report on the global methanol market has been segmented as follows:
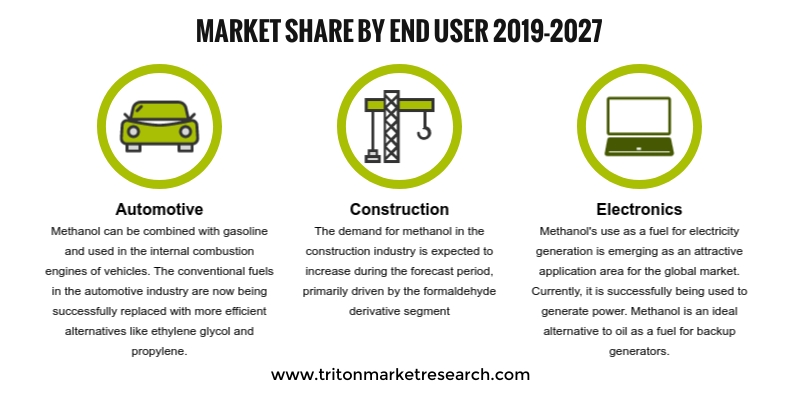
• End-User:
O Automotive
O Construction
O Electronics
O Paints and Coatings
O Others
• Derivatives:
O Formaldehyde
O Acetic acid
O Gasoline
O DME
O MTBE and TAME
O Others
Some of the prominent players in the methanol market are Methanol Holdings (Trinidad), Limited (MHTL), Mitsubishi Chemicals, BASF AG, Teijin, Mitsui & Co Ltd, Valero Marketing and Supply Company, Zagros Petrochemical Company (ZPC), Celanese Corporation, Saudi Basic Industries Corporation, Petroliam Nasional Berhad (PETRONAS), Methanex Corporation and Qatar Fuel Additives Company Limited.
Each of these companies have been strategically analyzed for the methanol market in detail. The company profiles help to get into the information about the key market players in this industry and how much hold they have on the market. In spite of being technologically intensive, the immense growth opportunities are attracting new companies to enter the market and thus accelerate the intensity of competition.
1. GLOBAL
METHANOL MARKET - SUMMARY
2. INDUSTRY
OUTLOOK
2.1. MARKET
DEFINITION
2.2. KEY
INSIGHTS
2.2.1. AUTOMOTIVE
SECTOR HOLDS THE LARGEST MARKET SHARE
2.2.2. FORMALDEHYDE
IS WIDELY USED DERIVATIVE OF METHANOL
2.3. PORTER’S
FIVE FORCE ANALYSIS
2.3.1. THREAT
OF NEW ENTRANTS
2.3.2. THREAT
OF SUBSTITUTE
2.3.3. BARGAINING
POWER OF SUPPLIERS
2.3.4. BARGAINING
POWER OF BUYERS
2.3.5. INTENSITY
OF COMPETITIVE RIVALRY
2.4. MARKET
ATTRACTIVENESS INDEX
2.5. VENDOR
SCORECARD
2.6. MARKET
DRIVERS
2.6.1. RISING
ACCEPTANCE OF THE MTO TECHNOLOGY
2.6.2. RISE
IN THE DEMAND FOR PETROCHEMICALS
2.6.3. NEED
FOR CONVENTIONAL TRANSPORTATION FUELS
2.6.4. PROMOTION
OF METHANOL AS AN ALTERNATIVE FUEL BY THE GOVERNMENT
2.7. MARKET
RESTRAINTS
2.7.1. SCARCITY
OF RAW MATERIALS
2.7.2. USE
OF FUEL GRADE ETHANOL OR BIOETHANOL INSTEAD OF METHANOL
2.8. MARKET
OPPORTUNITIES
2.8.1. INCREASE
IN THE DEMAND FOR BIO-BASED PRODUCTS
2.8.2. DEVELOPMENT
IN TECHNOLOGY FOR BIOREFINING
2.8.3. APPLICATION
OF METHANOL AS A MARINE FUEL
2.9. MARKET
CHALLENGES
2.9.1. UNSTABLE METHANOL PRICES
2.9.2. ECONOMIC SLOWDOWN HINDERS THE DEMAND FOR
METHANOL
2.9.3. REGULATIONS AND POLICIES
3. METHANOL
MARKET OUTLOOK - BY END-USER
3.1. AUTOMOTIVE
3.2. CONSTRUCTION
3.3. ELECTRONICS
3.4. PAINTS
AND COATINGS
3.5. OTHER
END-USERS
4. METHANOL
MARKET OUTLOOK - BY DERIVATIVES
4.1. FORMALDEHYDE
4.2. ACETIC
ACID
4.3. GASOLINE
4.4. DME
4.5. MTBE
& TAME
4.6. OTHER
DERIVATIVES
5. METHANOL
MARKET - REGIONAL OUTLOOK
5.1. NORTH
AMERICA
5.1.1. MARKET
BY END-USER
5.1.2. MARKET
BY DERIVATIVES
5.1.3. COUNTRY
ANALYSIS
5.1.3.1. UNITED
STATES
5.1.3.2. CANADA
5.2. EUROPE
5.2.1. MARKET
BY END-USER
5.2.2. MARKET
BY DERIVATIVES
5.2.3. COUNTRY
ANALYSIS
5.2.3.1. UNITED
KINGDOM
5.2.3.2. GERMANY
5.2.3.3. FRANCE
5.2.3.4. SPAIN
5.2.3.5. ITALY
5.2.3.6. RUSSIA
5.2.3.7. THE
NETHERLANDS
5.2.3.8. REST
OF EUROPE
5.3. ASIA-PACIFIC
5.3.1. MARKET
BY END-USER
5.3.2. MARKET
BY DERIVATIVES
5.3.3. COUNTRY
ANALYSIS
5.3.3.1. CHINA
5.3.3.2. JAPAN
5.3.3.3. INDIA
5.3.3.4. SOUTH
KOREA
5.3.3.5. MALAYSIA
& INDONESIA
5.3.3.6. AUSTRALIA
& NEW ZEALAND
5.3.3.7. REST
OF ASIA-PACIFIC
5.4. LATIN
AMERICA
5.4.1. MARKET
BY END-USER
5.4.2. MARKET
BY DERIVATIVES
5.4.3. COUNTRY
ANALYSIS
5.4.3.1. BRAZIL
5.4.3.2. MEXICO
5.4.3.3. REST
OF LATIN AMERICA
5.5. MIDDLE
EAST AND AFRICA
5.5.1. MARKET
BY END-USER
5.5.2. MARKET
BY DERIVATIVES
5.5.3. COUNTRY
ANALYSIS
5.5.3.1. UNITED
ARAB EMIRATES
5.5.3.2. TURKEY
5.5.3.3. SAUDI
ARABIA
5.5.3.4. SOUTH
AFRICA
5.5.3.5. REST
OF MIDDLE EAST AND AFRICA
6. COMPETITIVE
LANDSCAPE
6.1. BASF
AG
6.2. CELANESE
CORPORATION
6.3. QATAR
FUEL ADDITIVES COMPANY LIMITED
6.4. METHANOL
HOLDINGS (TRINIDAD) LIMITED (MHTL)
6.5. METHANEX
CORPORATION
6.6. MITSUBISHI
CHEMICALS
6.7. MITSUI
& CO., LTD.
6.8. PETROLIAM
NASIONAL BERHAD (PETRONAS)
6.9. SAUDI
BASIC INDUSTRIES CORPORATION
6.10.
TEIJIN
6.11.
VALERO MARKETING AND SUPPLY
COMPANY
6.12.
ZAGROS PETROCHEMICAL COMPANY
(ZPC)
7. METHODOLOGY
& SCOPE
7.1. RESEARCH
SCOPE
7.2. SOURCES
OF DATA
7.3. RESEARCH
METHODOLOGY
TABLE 1: GLOBAL
METHANOL MARKET, BY GEOGRAPHY, 2019-2027 (IN $ MILLION)
TABLE 2: MARKET
ATTRACTIVENESS INDEX
TABLE 3: VENDOR
SCORECARD
TABLE 4: GLOBAL
METHANOL MARKET, BY END-USER, 2019-2027 (IN $ MILLION)
TABLE 5: GLOBAL
METHANOL MARKET, BY DERIVATIVES, 2019-2027 (IN $ MILLION)
TABLE 6: GLOBAL
METHANOL MARKET, BY GEOGRAPHY, 2019-2027 (IN $ MILLION)
TABLE 7: NORTH AMERICA
METHANOL MARKET, BY COUNTRY, 2019-2027 (IN $ MILLION)
TABLE 8: NORTH AMERICA
METHANOL MARKET, BY END-USER, 2019-2027 (IN $ MILLION)
TABLE 9: NORTH AMERICA
METHANOL MARKET, BY DERIVATIVES, 2019-2027 (IN $ MILLION)
TABLE 10: EUROPE
METHANOL MARKET, BY COUNTRY, 2019-2027 (IN $ MILLION)
TABLE 11: EUROPE
METHANOL MARKET, BY END-USER, 2019-2027 (IN $ MILLION)
TABLE 12: EUROPE
METHANOL MARKET, BY DERIVATIVES, 2019-2027 (IN $ MILLION)
TABLE 13: ASIA-PACIFIC
METHANOL MARKET, BY COUNTRY, 2019-2027 (IN $ MILLION)
TABLE 14: ASIA-PACIFIC
METHANOL MARKET, BY END-USER, 2019-2027 (IN $ MILLION)
TABLE 15: ASIA-PACIFIC
METHANOL MARKET, BY DERIVATIVES, 2019-2027 (IN $ MILLION)
TABLE 16: LATIN AMERICA
METHANOL MARKET, BY COUNTRY, 2019-2027 (IN $ MILLION)
TABLE 17: LATIN AMERICA
METHANOL MARKET, BY END-USER, 2019-2027 (IN $ MILLION)
TABLE 18: LATIN AMERICA
METHANOL MARKET, BY DERIVATIVES, 2019-2027 (IN $ MILLION)
TABLE 19: MIDDLE EAST
AND AFRICA METHANOL MARKET, BY COUNTRY, 2019-2027 (IN $ MILLION)
TABLE 20: MIDDLE EAST
AND AFRICA METHANOL MARKET, BY END-USER, 2019-2027 (IN $ MILLION)
TABLE 21: MIDDLE EAST
AND AFRICA METHANOL MARKET, BY DERIVATIVES, 2019-2027 (IN $ MILLION)
FIGURE 1: GLOBAL
METHANOL MARKET, BY END-USER, 2018 & 2027 (IN %)
FIGURE 2: GLOBAL AUTOMOTIVE
MARKET FOR METHANOL, 2019-2027 (IN $ MILLION)
FIGURE 3: GLOBAL
FORMALDEHYDE MARKET, 2019-2027 (IN $ MILLION)
FIGURE 4: PORTER’S FIVE
FORCE ANALYSIS
FIGURE 5: GLOBAL
METHANOL MARKET, BY AUTOMOTIVE, 2019-2027 (IN $ MILLION)
FIGURE 6: GLOBAL
METHANOL MARKET, BY CONSTRUCTION, 2019-2027 (IN $ MILLION)
FIGURE 7: GLOBAL
METHANOL MARKET, BY ELECTRONICS, 2019-2027 (IN $ MILLION)
FIGURE 8: GLOBAL
METHANOL MARKET, BY PAINTS AND COATINGS, 2019-2027 (IN $ MILLION)
FIGURE 9: GLOBAL
METHANOL MARKET, BY OTHER END-USERS, 2019-2027 (IN $ MILLION)
FIGURE 10: GLOBAL
METHANOL MARKET, BY FORMALDEHYDE, 2019-2027 (IN $ MILLION)
FIGURE 11: GLOBAL
METHANOL MARKET, BY ACETIC ACID, 2019-2027 (IN $ MILLION)
FIGURE 12: GLOBAL
METHANOL MARKET, BY GASOLINE, 2019-2027 (IN $ MILLION)
FIGURE 13: GLOBAL
METHANOL MARKET, BY DME, 2019-2027 (IN $ MILLION)
FIGURE 14: GLOBAL
METHANOL MARKET, BY MTBE & TAME, 2019-2027 (IN $ MILLION)
FIGURE 15: GLOBAL
METHANOL MARKET, BY OTHER DERIVATIVES, 2019-2027 (IN $ MILLION)
FIGURE 16: GLOBAL
METHANOL MARKET, REGIONAL OUTLOOK, 2018 & 2027 (IN %)
FIGURE 17: UNITED
STATES METHANOL MARKET, 2019-2027 (IN $ MILLION)
FIGURE 18: CANADA
METHANOL MARKET, 2019-2027 (IN $ MILLION)
FIGURE 19: UNITED
KINGDOM METHANOL MARKET, 2019-2027 (IN $ MILLION)
FIGURE 20: GERMANY
METHANOL MARKET, 2019-2027 (IN $ MILLION)
FIGURE 21: FRANCE
METHANOL MARKET, 2019-2027 (IN $ MILLION)
FIGURE 22: SPAIN
METHANOL MARKET, 2019-2027 (IN $ MILLION)
FIGURE 23: ITALY
METHANOL MARKET, 2019-2027 (IN $ MILLION)
FIGURE 24: RUSSIA
METHANOL MARKET, 2019-2027 (IN $ MILLION)
FIGURE 25: THE
NETHERLANDS METHANOL MARKET, 2019-2027 (IN $ MILLION)
FIGURE 26: REST OF
EUROPE METHANOL MARKET, 2019-2027 (IN $ MILLION)
FIGURE 27: CHINA
METHANOL MARKET, 2019-2027 (IN $ MILLION)
FIGURE 28: JAPAN
METHANOL MARKET, 2019-2027 (IN $ MILLION)
FIGURE 29: INDIA
METHANOL MARKET, 2019-2027 (IN $ MILLION)
FIGURE 30: SOUTH KOREA
METHANOL MARKET, 2019-2027 (IN $ MILLION)
FIGURE 31: MALAYSIA
& INDONESIA METHANOL MARKET, 2019-2027 (IN $ MILLION)
FIGURE 32: AUSTRALIA
& NEW ZEALAND METHANOL MARKET, 2019-2027 (IN $ MILLION)
FIGURE 33: REST OF
ASIA-PACIFIC METHANOL MARKET, 2019-2027 (IN $ MILLION)
FIGURE 34: BRAZIL
METHANOL MARKET, 2019-2027 (IN $ MILLION)
FIGURE 35: MEXICO
METHANOL MARKET, 2019-2027 (IN $ MILLION)
FIGURE 36: REST OF
LATIN AMERICA METHANOL MARKET, 2019-2027 (IN $ MILLION)
FIGURE 37: UNITED ARAB
EMIRATES METHANOL MARKET, 2019-2027 (IN $ MILLION)
FIGURE 38: TURKEY
METHANOL MARKET, 2019-2027 (IN $ MILLION)
FIGURE 39: SAUDI ARABIA
METHANOL MARKET, 2019-2027 (IN $ MILLION)
FIGURE 40: SOUTH AFRICA
METHANOL MARKET, 2019-2027 (IN $ MILLION)
FIGURE 41: REST OF
MIDDLE EAST AND AFRICA METHANOL MARKET, 2019-2027 (IN $ MILLION)