


Market By End-users, Derivatives And Geography | Forecast 2019-2027
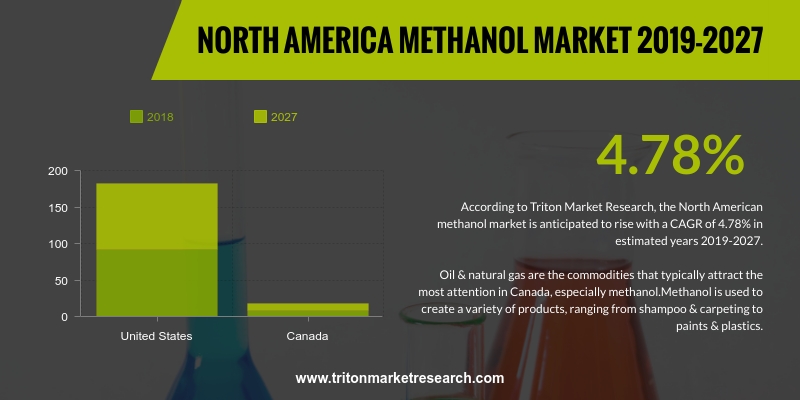
According to Triton Market Research, the North American methanol market is anticipated to rise with a CAGR of 4.78% in estimated years 2019-2027.
The market report on the North American region includes countries such as:
• Canada
• The United States
Report scope can be customized per your requirements. Request For Customization
Historically, the domestic production of methanol in North America was almost negligent. However, the boom of shale gas in North America has increased the demand for methanol in the region. Shale gas developments have successfully reduced the prices of natural gas. Vendors based in the region are embracing strategies like capacity restarts, plant relocation and Greenfield projects. With the shale gas boom in North America, the global import-export scenario will likely revive. This will lead to an additional capacity of methanol in the region and transform it from an importing to exporting region. Various new applications like directly blending methanol into gasoline, methanol into olefins and converting it to gasoline are currently being developed in the region.
Oil & natural gas are the commodities that typically attract the most attention in Canada, especially methanol. Methanol is used to create a variety of products, ranging from shampoo & carpeting to paints & plastics. Methanol is also used as a fuel for vehicles, and its price has been steadily ascending since the last couple of years. One of the world’s biggest players in the methanol market, Methanex, is located in Vancouver in Canada. Triton’s report on the methanol market studies the market definition and the key industrial insights. Factors such as the vendor scorecard, market attractiveness matrix, and Porter’s five force analysis have also been considered for this industry.
Market Segmented By Type, Appl ..
VIEW REPORT
Market By Raw Material, End-us ..
VIEW REPORT
Market by Type, Raw Material, ..
VIEW REPORT
Market by Technology, Type, En ..
VIEW REPORT
Market by Function, Product Ty ..
VIEW REPORT
Market by Product Type, Applic ..
VIEW REPORT
Market by Product, Industry Ve ..
VIEW REPORT
Market by Type, Material, Indu ..
VIEW REPORT1.
NORTH AMERICA METHANOL
MARKET - SUMMARY
2.
INDUSTRY
OUTLOOK
2.1. MARKET DEFINITION
2.2. KEY INSIGHTS
2.2.1. AUTOMOTIVE SECTOR HOLDS THE LARGEST MARKET SHARE
2.2.2. FORMALDEHYDE IS WIDELY USED DERIVATIVE OF METHANOL
2.3. PORTER’S FIVE FORCE ANALYSIS
2.3.1. THREAT OF NEW ENTRANTS
2.3.2. THREAT OF SUBSTITUTE
2.3.3. BARGAINING POWER OF SUPPLIERS
2.3.4. BARGAINING POWER OF BUYERS
2.3.5. INTENSITY OF COMPETITIVE RIVALRY
2.4. MARKET ATTRACTIVENESS INDEX
2.5. VENDOR SCORECARD
2.6. MARKET DRIVERS
2.6.1. RISING ACCEPTANCE OF THE MTO TECHNOLOGY
2.6.2. RISE IN THE DEMAND FOR PETROCHEMICALS
2.6.3. NEED FOR CONVENTIONAL TRANSPORTATION FUELS
2.6.4. PROMOTION OF METHANOL AS AN ALTERNATIVE FUEL BY THE GOVERNMENT
2.7. MARKET RESTRAINTS
2.7.1. SCARCITY OF RAW MATERIALS
2.7.2. USE OF FUEL GRADE ETHANOL OR BIOETHANOL INSTEAD OF METHANOL
2.8. MARKET OPPORTUNITIES
2.8.1. INCREASE IN THE DEMAND FOR BIO-BASED PRODUCTS
2.8.2. DEVELOPMENT IN TECHNOLOGY FOR BIOREFINING
2.8.3. APPLICATION OF METHANOL AS A MARINE FUEL
2.9. MARKET CHALLENGES
2.9.1. UNSTABLE METHANOL PRICES
2.9.2. ECONOMIC SLOWDOWN HINDERS THE DEMAND
FOR METHANOL
2.9.3. REGULATIONS AND POLICIES
3.
METHANOL MARKET
OUTLOOK - BY END-USER
3.1. AUTOMOTIVE
3.2. CONSTRUCTION
4.
METHANOL MARKET
OUTLOOK - BY DERIVATIVES
4.1. ACETIC ACID
4.2. GASOLINE
4.3. DME
4.4. MTBE & TAME
4.5. OTHER DERIVATIVES
5.
METHANOL MARKET
- NORTH AMERICA
5.1. UNITED STATES
5.2. CANADA
6.
COMPETITIVE
LANDSCAPE
6.1. BASF AG
6.2. CELANESE CORPORATION
6.3. QATAR FUEL ADDITIVES COMPANY LIMITED
6.4. METHANOL HOLDINGS (TRINIDAD) LIMITED (MHTL)
6.5. METHANEX CORPORATION
6.6. MITSUBISHI CHEMICALS
6.7. MITSUI & CO., LTD.
6.8. PETROLIAM NASIONAL BERHAD (PETRONAS)
6.9. SAUDI BASIC INDUSTRIES CORPORATION
6.10.
TEIJIN
6.11.
VALERO
MARKETING AND SUPPLY COMPANY
6.12.
ZAGROS
PETROCHEMICAL COMPANY (ZPC)
7.
METHODOLOGY
& SCOPE
7.1. RESEARCH SCOPE
7.2. SOURCES OF DATA
7.3. RESEARCH METHODOLOGY
TABLE 1: NORTH AMERICA METHANOL MARKET, BY GEOGRAPHY, 2019-2027 (IN $
MILLION)
TABLE 2: MARKET ATTRACTIVENESS INDEX
TABLE 3: VENDOR SCORECARD
TABLE 4: NORTH AMERICA METHANOL MARKET, BY COUNTRY, 2019-2027 (IN $
MILLION)
TABLE 5: NORTH AMERICA METHANOL MARKET, BY END-USER, 2019-2027 (IN $
MILLION)
TABLE 6: NORTH AMERICA METHANOL MARKET, BY
DERIVATIVES, 2019-2027 (IN $ MILLION)
FIGURE 1: NORTH AMERICA METHANOL MARKET, BY END-USER, 2018 & 2027
(IN %)
FIGURE 2: NORTH AMERICA AUTOMOTIVE MARKET FOR METHANOL, 2019-2027 (IN $
MILLION)
FIGURE 3: NORTH AMERICA FORMALDEHYDE MARKET, 2019-2027 (IN $ MILLION)
FIGURE 4: PORTER’S FIVE FORCE ANALYSIS
FIGURE 5: NORTH AMERICA METHANOL MARKET, BY AUTOMOTIVE, 2019-2027 (IN $
MILLION)
FIGURE 6: NORTH AMERICA METHANOL MARKET, BY CONSTRUCTION, 2019-2027 (IN
$ MILLION)
FIGURE 7: NORTH AMERICA METHANOL MARKET, BY ELECTRONICS, 2019-2027 (IN $
MILLION)
FIGURE 8: NORTH AMERICA METHANOL MARKET, BY PAINTS AND COATINGS,
2019-2027 (IN $ MILLION)
FIGURE 9: NORTH AMERICA METHANOL MARKET, BY OTHER END-USERS, 2019-2027
(IN $ MILLION)
FIGURE 10: NORTH AMERICA METHANOL MARKET, BY FORMALDEHYDE, 2019-2027 (IN
$ MILLION)
FIGURE 11: NORTH AMERICA METHANOL MARKET, BY ACETIC ACID, 2019-2027 (IN
$ MILLION)
FIGURE 12: NORTH AMERICA METHANOL MARKET, BY GASOLINE, 2019-2027 (IN $
MILLION)
FIGURE 13: NORTH AMERICA METHANOL MARKET, BY DME, 2019-2027 (IN $
MILLION)
FIGURE 14: NORTH AMERICA METHANOL MARKET, BY MTBE & TAME, 2019-2027
(IN $ MILLION)
FIGURE 15: NORTH AMERICA METHANOL MARKET, BY OTHER DERIVATIVES,
2019-2027 (IN $ MILLION)
FIGURE 16: NORTH AMERICA METHANOL MARKET, REGIONAL OUTLOOK, 2018 &
2027 (IN %)
FIGURE 17: UNITED STATES METHANOL MARKET, 2019-2027 (IN $ MILLION)
FIGURE 18: CANADA METHANOL MARKET, 2019-2027 (IN $ MILLION)