


Market By Demographics, Products, Devices, Services And Geography | Forecast 2019-2027
The natural aging process of the body involves biochemical processes that result in its gradual degeneration over a period of time, affecting the physical appearance of an individual. Anti-aging products refer to all products that are used for the prevention of skin and hair-related issues due to old age. The anti-aging market deals with services, products and devices that are anticipated to deliver anti-aging properties.
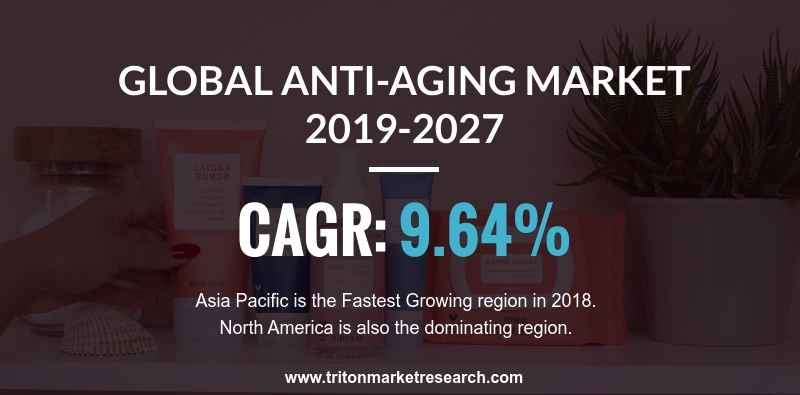
Triton Market Research predicts that the global market for anti-aging would witness a CAGR of 7.94% over the forecast period 2019-2027. The market was assessed to be worth $172166.67 million in the year 2018 and is predicted to generate a revenue of approximately $340344.52 million by the year 2027.
Triton Market Research’s report on the global anti-aging market provides an in-depth insight of the market. The detailed analysis of the market includes the key insights, evolution & transition of the industry, parent market analysis, industry player positioning, Porter’s five force analysis, market attractiveness index, vendor scorecard, industry components, key impact analysis and the regulatory framework.
The market is driven by several factors, such as the upsurge in aging population, growing population with obesity, aggregated awareness of anti-aging products and novel inventions in anti-aging treatments. However, the increasing aging population, due to decrease in mortality rate and increasing infertility, is a primary driver propelling the growth of the anti-aging products and services market. As per the Economic and Social Affairs of the United Nations, in the year 2017, around 962 million people aged 60 or over were present across the world, encompassing 13% of the world population. That would increase to 2.1 billion in 2050 and could rise to 3.1 billion in 2100. According to the United States Centre for Disease Control (CDC), the number of Americans aged 65 years or above is expected to be 89 million by 2050. Various statistics from the MIT Age Lab, CDC and WHO suggest that 50% of Europe’s population will comprise senior citizens by 2030. Hence, the rapidly growing aging population would use anti-aging products such as UV absorbers & anti-wrinkle creams; and services such as anti-pigmentation, adult acne therapy & devices for looking attractive.
Further, the rising disposable incomes, coupled with increase in marketing initiatives & increasing number of hair restoration procedures, are expected to create an affluent opportunity for the anti-aging market. The emergence of multifunctional products has also been one of the major trends in the market. In these products, different functions are incorporated into a single product addressing multiple concerns. For instance, Garnier has introduced its Skin Renew Miracle Anti-Aging BB Cream, which is an all-in-one purpose cream that can be used as a serum, moisturizer, primer, foundation and sunblock.
The market has been negatively affected due to shifting consumer preference towards natural & organic products, side-effects of anti-aging products and the rapid adoption of home remedies. Some anti-aging products involve side-effects that are expected to hinder the market growth of anti-aging. For instance, as per the Campaign for Safe Cosmetics (2015), a toxic perfluorooctanoic acid (PFOA) was found in anti-aging products, which is responsible for cancer. Some anti-aging creams contain ingredients that are harmful for the skin and have various side-effects, such as skin irritation, rashes, burning, redness, premature aging, etc. Stringent government regulations regarding cosmetics and devices are also hindering the market growth.
Key geographies covered in the global anti-aging market are:
• North America: United States and Canada
• Europe: United Kingdom, France, Germany, Spain, Italy, Russia and Rest of Europe
• Asia-Pacific: China, Japan, India, Australia, South Korea, ASEAN Countries and Rest of the Asia-Pacific
• Latin America: Brazil, Mexico and Rest of Latin America
• Middle East and Africa: Saudi Arabia, Turkey, United Arab Emirates, South Africa and Rest of the Middle East & Africa
The segmentation analysis of the anti-aging market includes:
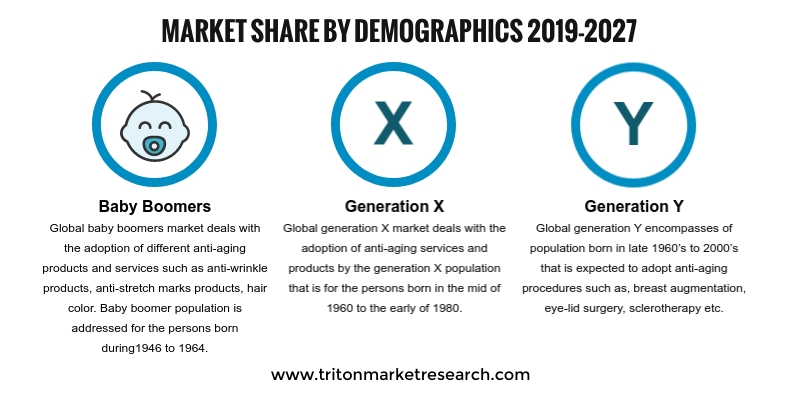
• Demographic segment includes:
O Baby boomers
O Generation X
O Generation Y
• Product segment includes:
O UV absorbers
O Anti-stretch marks products
O Anti-wrinkle products
O Hair colour
• Devices segment includes:
O Anti-cellulite treatment devices
O Microdermabrasion devices
O Aesthetic laser devices
O Radiofrequency devices
• Service segment includes:
O Anti-pigmentation therapy
O Adult acne therapy
O Breast augmentation
O Liposuction services
O Abdominoplasty
O Chemical peel
O Eye-lid surgery
O Hair restoration
O Sclerotherapy
The global anti-aging market is highly fragmented and consists of multiple well-established vendors offering a wide range of products targeted at various needs of consumers. The market has number of players and some of the major key players involved in the global anti-aging market are Lumenis Ltd. (acquired by Xio), Solta Medical (Valeant Pharmaceuticals), Alma Lasers Inc. (acquired by Fosun Pharma), Lutronic Corporation, Olay (acquired by Procter & Gamble), Beiersdorf (acquired by Tchibo Holding AG), Syneron Candela, Avon Products Inc., Coty Inc., Personal Microderm, Allergan plc, L’oréal S.A., PhotoMedex Inc. (acquired by Radiancy, Inc.), Revlon and Cynosure (acquired by Hologic).
The strategic analysis for each of these companies in the global anti-aging market has been covered in detail.

Market By Category, Applicatio ..
VIEW REPORT
Market by RTD Type | Forecast ..
VIEW REPORT
Market by Product Type | Forec ..
VIEW REPORT
Market by Product, Application ..
VIEW REPORT
Market By Product Type, Specie ..
VIEW REPORT
Market by Ingredient Type, Age ..
VIEW REPORT
Market By Demographics, Produc ..
VIEW REPORT
Market by Type, Sales Channel, ..
VIEW REPORT1.
GLOBAL ANTI-AGING MARKET - SUMMARY
2.
INDUSTRY OUTLOOK
2.1. MARKET DEFINITION
2.2. PARENT MARKET ANALYSIS: BEAUTY & PERSONAL
CARE MARKET
2.3. EVOLUTION & TRANSITION OF ANTI-AGING
PRODUCTS, SERVICES & DEVICES
2.4. KEY INSIGHTS
2.4.1. ADVENT OF MULTIFUNCTIONAL PRODUCTS AND UV
ABSORBERS
2.4.2. INCREASING DEMAND FOR ANTI-AGING HAIR CARE
PRODUCTS
2.4.3. HIGH NUMBER OF START-UPS
2.4.4. RISING AWARENESS TOWARDS THE AGING SIGNS
2.5. PORTER’S FIVE FORCE ANALYSIS
2.5.1. BARGAINING POWER OF BUYERS
2.5.2. BARGAINING POWER OF SUPPLIERS
2.5.3. THREAT OF NEW ENTRANTS
2.5.4. THREAT OF SUBSTITUTE
2.5.5. THREAT OF COMPETITIVE RIVALRY
2.6. KEY IMPACT ANALYSIS
2.6.1. BRAND VALUE
2.6.2. PRODUCTS REVIEWS
2.6.3. COST
2.6.4. FORMULATION
2.7. MARKET ATTRACTIVENESS INDEX
2.8. VENDOR SCORECARD
2.9. INDUSTRY COMPONENTS
2.9.1. SUPPLIERS
2.9.2. RESEARCH & DEVELOPMENT
2.9.3. MANUFACTURING/PRODUCTION
2.9.4. DISTRIBUTION & MARKETING
2.9.5. END-USERS
2.10. REGULATORY FRAMEWORK
2.11. INDUSTRY PLAYER POSITIONING
2.12. MARKET DRIVERS
2.12.1. UPSURGE IN AGING POPULATION
2.12.2. GROWING POPULATION WITH OBESITY
2.12.3. AGGREGATED AWARENESS OF ANTI-AGING PRODUCTS
2.12.4. NOVEL INVENTIONS IN ANTI-AGING TREATMENTS
2.13. MARKET RESTRAINTS
2.13.1. SHIFTING CONSUMER PREFERENCE TOWARDS NATURAL
& ORGANIC PRODUCTS
2.13.2. LOGISTICS CONCERNS
2.13.3. SIDE-EFFECTS OF ANTI-AGING PRODUCTS
2.14. MARKET OPPORTUNITIES
2.14.1. RISING HOUSEHOLD DISPOSABLE INCOME PER CAPITA
2.14.2. ENHANCED MARKETING & PROMOTION TECHNIQUES
2.14.3. RAPID ADOPTION OF HAIR RESTORATION
TECHNOLOGIES
2.15. MARKET CHALLENGES
2.15.1. ADOPTION OF HOME REMEDIES BY MAJOR PORTION OF
CONSUMERS
2.15.2. STRINGENT GOVERNMENT REGULATIONS REGARDING
COSMETICS AND DEVICES
3.
GLOBAL ANTI-AGING MARKET OUTLOOK - BY DEMOGRAPHICS
3.1. BABY BOOMERS
3.2. GENERATION X
3.3. GENERATION Y
4.
GLOBAL ANTI-AGING MARKET OUTLOOK - BY PRODUCTS
4.1. UV ABSORBERS
4.2. ANTI-WRINKLE
4.3. ANTI-STRETCH MARKS
4.4. HAIR COLOR
5.
GLOBAL ANTI-AGING MARKET OUTLOOK - BY DEVICES
5.1. ANTI-CELLULITE TREATMENT DEVICES
5.2. MICRODERM ABRASION DEVICES
5.3. AESTHETIC LASER DEVICES
5.4. RADIOFREQUENCY DEVICES
6.
GLOBAL ANTI-AGING MARKET OUTLOOK - BY SERVICES
6.1. ANTI-PIGMENTATION THERAPY
6.2. ADULT ACNE THERAPY
6.3. BREAST AUGMENTATION
6.4. LIPOSUCTION SERVICES
6.5. ABDOMINOPLASTY
6.6. CHEMICAL PEEL
6.7. EYELID SURGERY
6.8. HAIR RESTORATION
6.9. SCLEROTHERAPY
6.10. OTHER SERVICES
7.
GLOBAL ANTI-AGING MARKET - REGIONAL OUTLOOK
7.1. NORTH AMERICA
7.1.1. MARKET BY DEMOGRAPHICS
7.1.2. MARKET BY PRODUCTS, DEVICES & SERVICES
7.1.3. MARKET BY PRODUCTS
7.1.4. MARKET BY DEVICES
7.1.5. MARKET BY SERVICES
7.1.6. COUNTRY ANALYSIS
7.1.6.1.
UNITED STATES
7.1.6.2.
CANADA
7.2. EUROPE
7.2.1. MARKET BY DEMOGRAPHICS
7.2.2. MARKET BY PRODUCTS, DEVICES & SERVICES
7.2.3. MARKET BY PRODUCTS
7.2.4. MARKET BY DEVICES
7.2.5. MARKET BY SERVICES
7.2.6. COUNTRY ANALYSIS
7.2.6.1.
UNITED KINGDOM
7.2.6.2.
GERMANY
7.2.6.3.
FRANCE
7.2.6.4.
SPAIN
7.2.6.5.
ITALY
7.2.6.6.
RUSSIA
7.2.6.7.
REST OF EUROPE
7.3. ASIA-PACIFIC
7.3.1. MARKET BY DEMOGRAPHICS
7.3.2. MARKET BY PRODUCTS, DEVICES & SERVICES
7.3.3. MARKET BY PRODUCTS
7.3.4. MARKET BY DEVICES
7.3.5. MARKET BY SERVICES
7.3.6. COUNTRY ANALYSIS
7.3.6.1.
CHINA
7.3.6.2.
JAPAN
7.3.6.3.
INDIA
7.3.6.4.
SOUTH KOREA
7.3.6.5.
ASEAN COUNTRIES
7.3.6.6.
AUSTRALIA & NEW ZEALAND
7.3.6.7.
REST OF ASIA-PACIFIC
7.4. LATIN AMERICA
7.4.1. MARKET BY DEMOGRAPHICS
7.4.2. MARKET BY PRODUCTS, DEVICES & SERVICES
7.4.3. MARKET BY PRODUCTS
7.4.4. MARKET BY DEVICES
7.4.5. MARKET BY SERVICES
7.4.6. COUNTRY ANALYSIS
7.4.6.1.
BRAZIL
7.4.6.2.
MEXICO
7.4.6.3.
REST OF LATIN AMERICA
7.5. MIDDLE EAST AND AFRICA
7.5.1. MARKET BY DEMOGRAPHICS
7.5.2. MARKET BY PRODUCTS, DEVICES & SERVICES
7.5.3. MARKET BY PRODUCTS
7.5.4. MARKET BY DEVICES
7.5.5. MARKET BY SERVICES
7.5.6. COUNTRY ANALYSIS
7.5.6.1.
UNITED ARAB EMIRATES
7.5.6.2.
TURKEY
7.5.6.3.
SAUDI ARABIA
7.5.6.4.
SOUTH AFRICA
7.5.6.5.
REST OF MIDDLE EAST & AFRICA
8.
COMPETITIVE LANDSCAPE
8.1. LUMENIS LTD. (ACQUIRED BY XIO)
8.2. SOLTA MEDICAL (VALEANT PHARMACEUTICALS)
8.3. ALMA LASERS, INC. (ACQUIRED BY FOSUN PHARMA)
8.4. LUTRONIC CORPORATION
8.5. OLAY (ACQUIRED BY PROCTER & GAMBLE)
8.6. BEIERSDORF (ACQUIRED BY TCHIBO HOLDING AG)
8.7. SYNERON CANDELA
8.8. AVON PRODUCTS, INC.
8.9. COTY, INC.
8.10. PERSONAL MICRODERM
8.11. ALLERGAN PLC
8.12. L'ORÉAL S.A.
8.13. PHOTOMEDEX, INC. (ACQUIRED BY RADIANCY, INC.)
8.14. REVLON
8.15. CYNOSURE (ACQUIRED BY HOLOGIC)
9.
RESEARCH METHODOLOGY & SCOPE
9.1. RESEARCH SCOPE & DELIVERABLES
9.2. SOURCES OF DATA
9.3. RESEARCH METHODOLOGY
TABLE 1: GLOBAL ANTI-AGING MARKET, BY GEOGRAPHY, 2019-2027 (IN $
MILLION)
TABLE 2: GLOBAL ANTI-AGING MARKET, BY PRODUCTS, DEVICES & SERVICES,
2019-2027 (IN $ MILLION)
TABLE 3: EVOLUTION & TRANSITION OF ANTI-AGING PRODUCTS, SERVICES
& DEVICES
TABLE 4: PROMINENT START-UPS IN ANTI-AGING MARKET
TABLE 5: LIFETIME UV EXPOSURE IN UNITED STATES (IN %)
TABLE 6: VENDOR SCORECARD
TABLE 7: REGULATORY FRAMEWORK
TABLE 8: PRODUCERS GROWTH IN ANTI-AGING MARKET
TABLE 9: REGIONWISE GROWTH IN AGING POPULATION, 2015-2050F
TABLE 10: GLOBAL ANTI-AGING MARKET, BY DEMOGRAPHICS, 2019-2027 (IN $
MILLION)
TABLE 11: GLOBAL ANTI-AGING MARKET, BY PRODUCTS, 2019-2027 (IN $
MILLION)
TABLE 12: GLOBAL ANTI-AGING MARKET, BY DEVICES, 2019-2027 (IN $ MILLION)
TABLE 13: GLOBAL ANTI-AGING MARKET, BY SERVICES, 2019-2027 (IN $
MILLION)
TABLE 14: GLOBAL ANTI-AGING MARKET, BY GEOGRAPHY, 2019-2027 (IN $
MILLION)
TABLE 15: NORTH AMERICA ANTI-AGING MARKET, BY COUNTRY, 2019-2027 (IN $
MILLION)
TABLE 16: NORTH AMERICA ANTI-AGING MARKET, BY DEMOGRAPHICS, 2019-2027
(IN $ MILLION)
TABLE 17: NORTH AMERICA ANTI-AGING MARKET, BY PRODUCTS, DEVICES & SERVICES,
2019-2027 (IN $ MILLION)
TABLE 18: NORTH AMERICA ANTI-AGING MARKET, BY PRODUCTS, 2019-2027 (IN $
MILLION)
TABLE 19: NORTH AMERICA ANTI-AGING MARKET, BY DEVICES, 2019-2027 (IN $
MILLION)
TABLE 20: NORTH AMERICA ANTI-AGING MARKET, BY SERVICES, 2019-2027 (IN $
MILLION)
TABLE 21: EUROPE ANTI-AGING MARKET, BY COUNTRY, 2019-2027 (IN $ MILLION)
TABLE 22: EUROPE ANTI-AGING MARKET, BY DEMOGRAPHICS, 2019-2027 (IN $
MILLION)
TABLE 23: EUROPE ANTI-AGING MARKET, BY PRODUCTS, DEVICES & SERVICES,
2019-2027 (IN $ MILLION)
TABLE 24: EUROPE ANTI-AGING MARKET, BY PRODUCTS, 2019-2027 (IN $
MILLION)
TABLE 25: EUROPE ANTI-AGING MARKET, BY DEVICES, 2019-2027 (IN $ MILLION)
TABLE 26: EUROPE ANTI-AGING MARKET, BY SERVICES, 2019-2027 (IN $
MILLION)
TABLE 27: ASIA-PACIFIC ANTI-AGING MARKET, BY COUNTRY, 2019-2027 (IN $
MILLION)
TABLE 28: ASIA-PACIFIC ANTI-AGING MARKET, BY DEMOGRAPHICS, 2019-2027 (IN
$ MILLION)
TABLE 29: ASIA-PACIFIC ANTI-AGING MARKET, BY PRODUCTS, DEVICES &
SERVICES, 2019-2027 (IN $ MILLION)
TABLE 30: ASIA-PACIFIC ANTI-AGING MARKET, BY PRODUCTS, 2019-2027 (IN $
MILLION)
TABLE 31: ASIA-PACIFIC ANTI-AGING MARKET, BY DEVICES, 2019-2027 (IN $
MILLION)
TABLE 32: ASIA-PACIFIC ANTI-AGING MARKET, BY SERVICES, 2019-2027 (IN $
MILLION)
TABLE 33: LATIN AMERICA ANTI-AGING MARKET, BY COUNTRY, 2019-2027 (IN $
MILLION)
TABLE 34: LATIN AMERICA ANTI-AGING MARKET, BY DEMOGRAPHICS, 2019-2027
(IN $ MILLION)
TABLE 35: LATIN AMERICA ANTI-AGING MARKET, BY PRODUCTS, DEVICES &
SERVICES, 2019-2027 (IN $ MILLION)
TABLE 36: LATIN AMERICA ANTI-AGING MARKET, BY PRODUCTS, 2019-2027 (IN $
MILLION)
TABLE 37: LATIN AMERICA ANTI-AGING MARKET, BY DEVICES, 2019-2027 (IN $
MILLION)
TABLE 38: LATIN AMERICA ANTI-AGING MARKET, BY SERVICES, 2019-2027 (IN $
MILLION)
TABLE 39: MIDDLE EAST AND AFRICA ANTI-AGING MARKET, BY COUNTRY,
2019-2027 (IN $ MILLION)
TABLE 40: MIDDLE EAST AND AFRICA ANTI-AGING MARKET, BY DEMOGRAPHICS,
2019-2027 (IN $ MILLION)
TABLE 41: MIDDLE EAST AND AFRICA ANTI-AGING MARKET, BY PRODUCTS, DEVICES
& SERVICES, 2019-2027 (IN $ MILLION)
TABLE 42: MIDDLE EAST AND AFRICA ANTI-AGING MARKET, BY PRODUCTS,
2019-2027 (IN $ MILLION)
TABLE 43: MIDDLE EAST AND AFRICA ANTI-AGING MARKET, BY DEVICES,
2019-2027 (IN $ MILLION)
TABLE 44: MIDDLE EAST AND AFRICA ANTI-AGING MARKET, BY SERVICES,
2019-2027 (IN $ MILLION)
FIGURE 1: KEY BUYING IMPACT ANALYSIS
FIGURE 2: MARKET ATTRACTIVENESS INDEX
FIGURE 3: INDUSTRY COMPONENTS
FIGURE 4: INDUSTRY PLAYER POSITIONING IN 2018 (IN %)
FIGURE 5: WORLDWIDE GERIATRIC POPULATION (AGED 65 YEARS & ABOVE), 2014-2022
(IN MILLION)
FIGURE 6: COUNTRIES WITH MOST OBESE POPULATION (IN %)
FIGURE 7: PATENT APPLICATIONS RECEIVED FOR ANTI-AGING MOISTURIZERS WITH
NATURAL INGREDIENTS
FIGURE 8: HOUSEHOLD DISPOSABLE INCOME PER CAPITA OF OECD COUNTRIES IN
2017 (IN $)
FIGURE 9: GLOBAL ANTI-AGING MARKET, BY BABY BOOMERS, 2019-2027 (IN $
MILLION)
FIGURE 10: GLOBAL ANTI-AGING MARKET, BY GENERATION X, 2019-2027 (IN $
MILLION)
FIGURE 11: GLOBAL ANTI-AGING MARKET, BY GENERATION Y, 2019-2027 (IN $
MILLION)
FIGURE 12: GLOBAL ANTI-AGING MARKET, BY UV ABSORBERS, 2019-2027 (IN $
MILLION)
FIGURE 13: GLOBAL ANTI-AGING MARKET, BY ANTI-WRINKLE, 2019-2027 (IN $
MILLION)
FIGURE 14: GLOBAL ANTI-AGING MARKET, BY ANTI-STRETCH MARKS, 2019-2027
(IN $ MILLION)
FIGURE 15: GLOBAL ANTI-AGING MARKET, BY HAIR COLOR, 2019-2027 (IN $
MILLION)
FIGURE 16: GLOBAL ANTI-AGING MARKET, BY ANTI-CELLULITE TREATMENT
DEVICES, 2019-2027 (IN $ MILLION)
FIGURE 17: GLOBAL ANTI-AGING MARKET, BY MICRODERM ABRASION DEVICES,
2019-2027 (IN $ MILLION)
FIGURE 18: GLOBAL ANTI-AGING MARKET, BY AESTHETIC LASER DEVICES,
2019-2027 (IN $ MILLION)
FIGURE 19: GLOBAL ANTI-AGING MARKET, BY RADIOFREQUENCY DEVICES,
2019-2027 (IN $ MILLION)
FIGURE 20: GLOBAL ANTI-AGING MARKET, BY ANTI-PIGMENTATION THERAPY,
2019-2027 (IN $ MILLION)
FIGURE 21: GLOBAL ANTI-AGING MARKET, BY ADULT ACNE THERAPY, 2019-2027
(IN $ MILLION)
FIGURE 22: GLOBAL ANTI-AGING MARKET, BY BREAST AUGMENTATION, 2019-2027
(IN $ MILLION)
FIGURE 23: GLOBAL ANTI-AGING MARKET, BY LIPOSUCTION SERVICES, 2019-2027
(IN $ MILLION)
FIGURE 24: GLOBAL ANTI-AGING MARKET, BY ABDOMINOPLASTY, 2019-2027 (IN $
MILLION)
FIGURE 25: GLOBAL ANTI-AGING MARKET, BY CHEMICAL PEEL, 2019-2027 (IN $
MILLION)
FIGURE 26: GLOBAL ANTI-AGING MARKET, BY EYELID SURGERY, 2019-2027 (IN $
MILLION)
FIGURE 27: GLOBAL ANTI-AGING MARKET, BY HAIR RESTORATION, 2019-2027 (IN
$ MILLION)
FIGURE 28: GLOBAL ANTI-AGING MARKET, BY SCLEROTHERAPY, 2019-2027 (IN $
MILLION)
FIGURE 29: GLOBAL ANTI-AGING MARKET, BY OTHER SERVICES, 2019-2027 (IN $
MILLION)
FIGURE 30: UNITED STATES ANTI-AGING MARKET, 2019-2027 (IN $ MILLION)
FIGURE 31: CANADA ANTI-AGING MARKET, 2019-2027 (IN $ MILLION)
FIGURE 32: UNITED KINGDOM ANTI-AGING MARKET, 2019-2027 (IN $ MILLION)
FIGURE 33: GERMANY ANTI-AGING MARKET, 2019-2027 (IN $ MILLION)
FIGURE 34: FRANCE ANTI-AGING MARKET, 2019-2027 (IN $ MILLION)
FIGURE 35: SPAIN ANTI-AGING MARKET, 2019-2027 (IN $ MILLION)
FIGURE 36: ITALY ANTI-AGING MARKET, 2019-2027 (IN $ MILLION)
FIGURE 37: RUSSIA ANTI-AGING MARKET, 2019-2027 (IN $ MILLION)
FIGURE 38: REST OF EUROPE ANTI-AGING MARKET, 2019-2027 (IN $ MILLION)
FIGURE 39: CHINA ANTI-AGING MARKET, 2019-2027 (IN $ MILLION)
FIGURE 40: JAPAN ANTI-AGING MARKET, 2019-2027 (IN $ MILLION)
FIGURE 41: INDIA ANTI-AGING MARKET, 2019-2027 (IN $ MILLION)
FIGURE 42: SOUTH KOREA ANTI-AGING MARKET, 2019-2027 (IN $ MILLION)
FIGURE 43: ASEAN COUNTRIES ANTI-AGING MARKET, 2019-2027 (IN $ MILLION)
FIGURE 44: AUSTRALIA & NEW ZEALAND ANTI-AGING MARKET, 2019-2027 (IN
$ MILLION)
FIGURE 45: REST OF ASIA-PACIFIC ANTI-AGING MARKET, 2019-2027 (IN $
MILLION)
FIGURE 46: BRAZIL ANTI-AGING MARKET, 2019-2027 (IN $ MILLION)
FIGURE 47: MEXICO ANTI-AGING MARKET, 2019-2027 (IN $ MILLION)
FIGURE 48: REST OF LATIN AMERICA ANTI-AGING MARKET, 2019-2027 (IN $
MILLION)
FIGURE 49: UNITED ARAB EMIRATES ANTI-AGING MARKET, 2019-2027 (IN $
MILLION)
FIGURE 50: TURKEY ANTI-AGING MARKET, 2019-2027 (IN $ MILLION)
FIGURE 51: SAUDI ARABIA ANTI-AGING MARKET, 2019-2027 (IN $ MILLION)
FIGURE 52: SOUTH AFRICA ANTI-AGING MARKET, 2019-2027 (IN $ MILLION)
FIGURE 53: REST OF MIDDLE EAST & AFRICA ANTI-AGING MARKET, 2019-2027
(IN $ MILLION)