

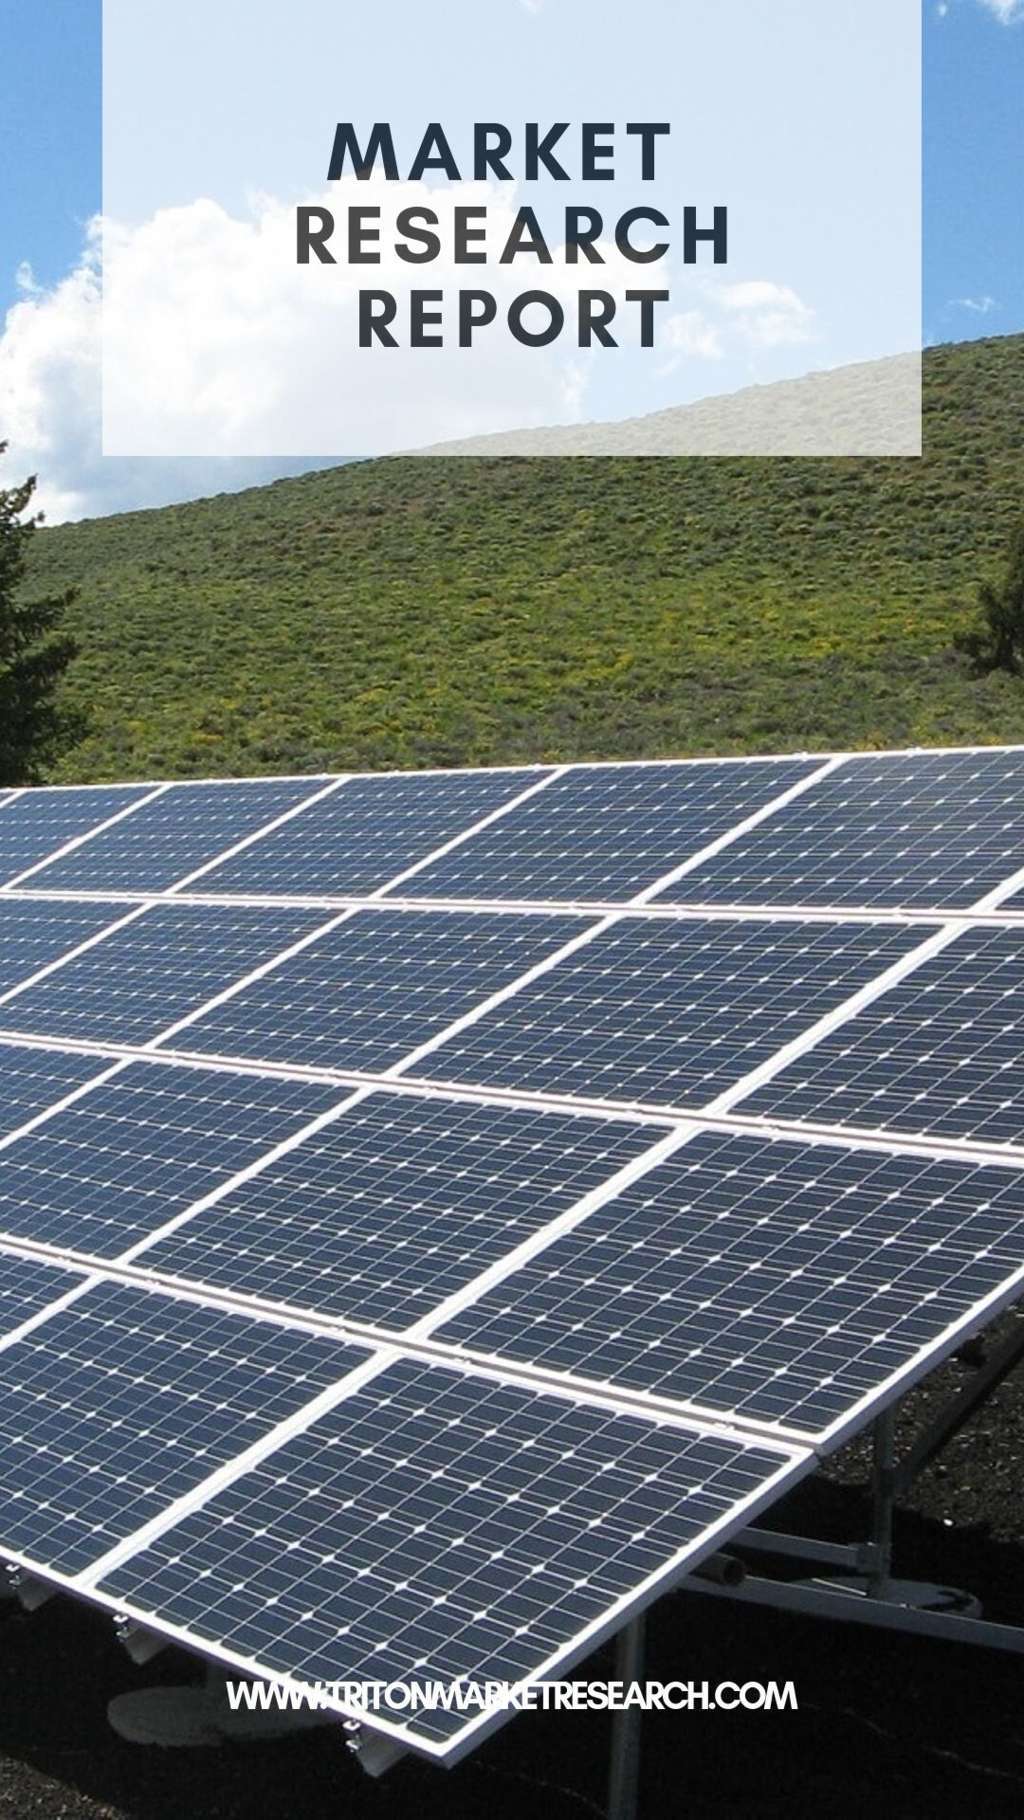
Market by Application, Component, and Industry Vertical | Forecast 2023-2028
Triton Market Research’s
report highlights that the nanotechnology in energy applications market in
China is expected to witness a CAGR of 13.25% in revenue over the forecast period
2023-2028. It is anticipated to generate $XX million by 2028.
Nanotechnology involves the
manipulation of matter at the atomic, molecular, or supramolecular level to
impart materials with performance characteristics that exceed those predicted
for bulk materials or to create devices with new properties induced by the
small size of the underlying constituents. In this regard, materials have
distinct physical, chemical, and biological characteristics from their bulk
counterparts. These properties arise from the increased surface-to-volume ratio
and quantum effects that become significant at the nanoscale. By manipulating
materials and devices at the nanoscale, scientists and engineers can enhance
the performance of energy systems, improve renewable energy technologies, and
develop new energy storage options.
The market for nanotechnology
in energy applications in China is expanding due to rising demand for renewable
energy. 2020 witnessed growth in the usage of renewable energy as demand for
all other fuels declined. The main factor was an almost 7% increase in power
production from renewable sources. Although there was less need for power,
there were issues with the supply chain and delays in many areas. The rise of
renewable energy was supported by priority access to the grid, long-term
contracts, and the constant installation of new plants.
A decrease in biofuels due to
lower oil demand substantially offset the 3% increase in the use of bioenergy
in the industrial verticals. Two-thirds of the growth in renewables is
anticipated to come from solar PV and wind. China contributed significantly to
global renewable power production in 2021, followed by the US, the EU, and
India.
However, the cost of
nanomaterials and nanotechnology-enabled devices can be a significant barrier
to their widespread implementation. Nanomaterial synthesis and fabrication
processes often require specialized equipment and precise control, leading to
higher production costs. Scaling up production while maintaining
cost-effectiveness remains a challenge in many cases. Moreover, transitioning
from laboratory-scale to large-scale production of nanomaterials and
nanotechnology devices is a complex task.
Some nanomaterials require
rare or expensive raw materials for production, leading to supply chain
challenges and increased costs. This can constrain the scalability and
commercialization of nanotechnology in the energy sector.
Triton Market Research’s
report provides in-depth insight into the China nanotechnology in energy
applications market, along with segmentation analysis. The detailed analysis of
the market includes PESTLE analysis, industry components, and market maturity analysis.
The segmentation analysis includes market
by application, component, and industry vertical.
The
established players in the nanotechnology in energy applications market include
Honeywell International Inc, Aspen Aerogels Inc, The Chemours Company, Advanced
Nano Products Co Ltd, and Jiangsu Cnano Technology Co Ltd.

MARKET BY INSULATION TYPE, MOU ..
VIEW REPORT
Market By Application, Type An ..
VIEW REPORT
Market By Products, Applicatio ..
VIEW REPORT
Market By Application, Type Of ..
VIEW REPORT
Market by Battery Type (Primar ..
VIEW REPORT
Market By Application, Chemist ..
VIEW REPORT
Market by Feedstock (Solid Bio ..
VIEW REPORT
Market by Type, Service, Techn ..
VIEW REPORT1. CHINA
NANOTECHNOLOGY IN ENERGY APPLICATIONS MARKET – SUMMARY
1.1. MARKET SIZE & FORECASTS
1.2. MARKET DEFINITION
1.3. MARKET DRIVING ASPECTS
1.4. MARKET CHALLENGING ASPECTS
1.5. KEY PLAYERS
2. CHINA
NANOTECHNOLOGY IN ENERGY APPLICATIONS MARKET OUTLOOK
2.1. PESTLE
ANALYSIS
2.2. EMERGING
UTILITY
2.3. LIFE-CYCLE
ASSESSMENT OF NANOMATERIALS
2.4. IMPACT
ANALYSIS ON THE NANOTECHNOLOGY IN ENERGY APPLICATIONS MARKET
2.4.1. COVID-19
IMPACT
2.4.2. UKRAINE-RUSSIA
WAR IMPACT
2.5. KEY
INSIGHTS
2.6. PORTER’S
FIVE FORCES ANALYSIS
2.6.1. THREAT
OF NEW ENTRANTS
2.6.2. THREAT
OF SUBSTITUTES
2.6.3. BARGAINING
POWER OF BUYERS
2.6.4. BARGAINING
POWER OF SUPPLIERS
2.6.5. THREAT
OF COMPETITIVE RIVALRY
2.7. MARKET
MATURITY ANALYSIS
2.8. INDUSTRY
COMPONENTS
2.8.1. RESEARCH
& DEVELOPMENT (R&D)
2.8.2. NANOMATERIAL
MANUFACTURING
2.8.3. COMPONENT
& DEVICE MANUFACTURING
2.8.4. SYSTEM
INTEGRATION & ASSEMBLY
2.8.5. DISTRIBUTION
& SALES
2.8.6. INSTALLATION
& DEPLOYMENT
2.9. REGULATORY
FRAMEWORK
2.10. KEY
MARKET STRATEGIES
2.10.1. COLLABORATIONS
2.10.2. PRODUCT
LAUNCHES
2.10.3. BUSINESS
DIVESTITURES & EXPANSIONS
2.11. ANALYST
PERSPECTIVE
3. CHINA
NANOTECHNOLOGY IN ENERGY APPLICATIONS MARKET – BY APPLICATION
3.1. SOLAR
PHOTOVOLTAICS
3.2. ENERGY
STORAGE DEVICE
3.3. FUEL
CELL
3.4. PETROLEUM
REFINING
3.5. OTHER
APPLICATIONS
4. CHINA
NANOTECHNOLOGY IN ENERGY APPLICATIONS MARKET – BY COMPONENT
4.1. NANOTHIN
FILM
4.2. NANOSENSOR
4.3. SOLID
NANOPARTICLE
4.4. NANO-STRUCTURE
MONOLITHIC
4.5. OTHER
COMPONENTS
5. CHINA
NANOTECHNOLOGY IN ENERGY APPLICATIONS MARKET – BY INDUSTRY VERTICAL
5.1. MANUFACTURING
5.2. ELECTRICAL
5.3. TRANSPORT
5.4. OTHER
INDUSTRY VERTICALS
6. COMPETITIVE
LANDSCAPE
6.1. HONEYWELL
INTERNATIONAL INC
6.1.1. OVERVIEW
6.1.2. PRODUCT
PORTFOLIO
6.1.3. KEY
STRENGTHS
6.1.4. KEY
CHALLENGES
6.2. ADVANCED
NANO PRODUCTS CO LTD
6.2.1. OVERVIEW
6.2.2. PRODUCT
PORTFOLIO
6.2.3. KEY
STRENGTHS
6.2.4. KEY
CHALLENGES
6.3. ASPEN
AEROGELS INC
6.3.1. OVERVIEW
6.3.2. PRODUCT
PORTFOLIO
6.3.3. KEY
STRENGTHS
6.3.4. KEY
CHALLENGES
6.4. JIANGSU
CNANO TECHNOLOGY CO LTD
6.4.1. OVERVIEW
6.4.2. PRODUCT
PORTFOLIO
6.4.3. KEY
STRENGTHS
6.4.4. KEY
CHALLENGES
6.5. THE
CHEMOURS COMPANY
6.5.1. OVERVIEW
6.5.2. PRODUCT
PORTFOLIO
6.5.3. KEY
STRENGTHS
6.5.4. KEY
CHALLENGES
6.6. BLACK
DIAMOND STRUCTURES LLC
6.6.1. OVERVIEW
6.6.2. PRODUCT
PORTFOLIO
6.7. NEI
CORPORATION
6.7.1. OVERVIEW
6.7.2. PRODUCT
PORTFOLIO
6.8. HYPERION
CATALYSIS INTERNATIONAL INC
6.8.1. OVERVIEW
6.8.2. PRODUCT
PORTFOLIO
6.9. A123
SYSTEMS LLC
6.9.1. OVERVIEW
6.9.2. PRODUCT
PORTFOLIO
6.10. ALTAIRNANO
6.10.1. OVERVIEW
6.10.2. PRODUCT
PORTFOLIO
7. RESEARCH
METHODOLOGY & SCOPE
7.1. RESEARCH
SCOPE & DELIVERABLES
7.2. SOURCES
OF DATA
7.3. RESEARCH
METHODOLOGY
TABLE
1: CHINA NANOTECHNOLOGY IN ENERGY APPLICATIONS MARKET 2023-2028 (IN $ MILLION)
TABLE
2: REGULATORY FRAMEWORK
TABLE
3: LIST OF COLLABORATIONS
TABLE
4: LIST OF PRODUCT LAUNCHES
TABLE
5: LIST OF BUSINESS DIVESTITURES & EXPANSIONS
TABLE
6: CHINA NANOTECHNOLOGY IN ENERGY APPLICATIONS MARKET, BY APPLICATION,
2023-2028 (IN $ MILLION)
TABLE
7: CHINA NANOTECHNOLOGY IN ENERGY APPLICATIONS MARKET, BY COMPONENT, 2023-2028
(IN $ MILLION)
TABLE
8: CHINA NANOTECHNOLOGY IN ENERGY APPLICATIONS MARKET, BY INDUSTRY VERTICAL,
2023-2028 (IN $ MILLION)
FIGURE
1: MARKET MATURITY ANALYSIS
FIGURE
2: INDUSTRY COMPONENTS
FIGURE
3: CHINA NANOTECHNOLOGY IN ENERGY APPLICATIONS MARKET, BY APPLICATION, 2022
& 2028 (IN %)
FIGURE
4: CHINA NANOTECHNOLOGY IN ENERGY APPLICATIONS MARKET, BY SOLAR PHOTOVOLTAICS,
2023-2028 (IN $ MILLION)
FIGURE
5: CHINA NANOTECHNOLOGY IN ENERGY APPLICATIONS MARKET, BY ENERGY DEVICE
STORAGE, 2023-2028 (IN $ MILLION)
FIGURE
6: CHINA NANOTECHNOLOGY IN ENERGY APPLICATIONS MARKET, BY FUEL CELL, 2023-2028
(IN $ MILLION)
FIGURE
7: CHINA NANOTECHNOLOGY IN ENERGY APPLICATIONS MARKET, BY PETROLEUM REFINING,
2023-2028 (IN $ MILLION)
FIGURE
8: CHINA NANOTECHNOLOGY IN ENERGY APPLICATIONS MARKET, BY OTHER APPLICATIONS,
2023-2028 (IN $ MILLION)
FIGURE
9: CHINA NANOTECHNOLOGY IN ENERGY APPLICATIONS MARKET, BY COMPONENT, 2022 &
2028 (IN %)
FIGURE
10: CHINA NANOTECHNOLOGY IN ENERGY APPLICATIONS MARKET, BY NANOTHIN FILM,
2023-2028 (IN $ MILLION)
FIGURE
11: CHINA NANOTECHNOLOGY IN ENERGY APPLICATIONS MARKET, BY NANOSENSOR,
2023-2028 (IN $ MILLION)
FIGURE
12: CHINA NANOTECHNOLOGY IN ENERGY APPLICATIONS MARKET, BY SOLID NANOPARTICLE,
2023-2028 (IN $ MILLION)
FIGURE
13: CHINA NANOTECHNOLOGY IN ENERGY APPLICATIONS MARKET, BY NANO-STRUCTURE
MONOLITHIC, 2023-2028 (IN $ MILLION)
FIGURE
14: CHINA NANOTECHNOLOGY IN ENERGY APPLICATIONS MARKET, BY OTHER COMPONENTS,
2023-2028 (IN $ MILLION)
FIGURE
15: CHINA NANOTECHNOLOGY IN ENERGY APPLICATIONS MARKET, BY INDUSTRY VERTICAL,
2022 & 2028 (IN %)
FIGURE
16: CHINA NANOTECHNOLOGY IN ENERGY APPLICATIONS MARKET, BY MANUFACTURING,
2023-2028 (IN $ MILLION)
FIGURE
17: CHINA NANOTECHNOLOGY IN ENERGY APPLICATIONS MARKET, BY ELECTRICAL,
2023-2028 (IN $ MILLION)
FIGURE
18: CHINA NANOTECHNOLOGY IN ENERGY APPLICATIONS MARKET, BY TRANSPORT, 2023-2028
(IN $ MILLION)
FIGURE
19: CHINA NANOTECHNOLOGY IN ENERGY APPLICATIONS MARKET, BY OTHER INDUSTRY
VERTICALS, 2023-2028 (IN $ MILLION)