


Market By Type, Cable Type, Material, Application And Geography | Forecast 2019-2027
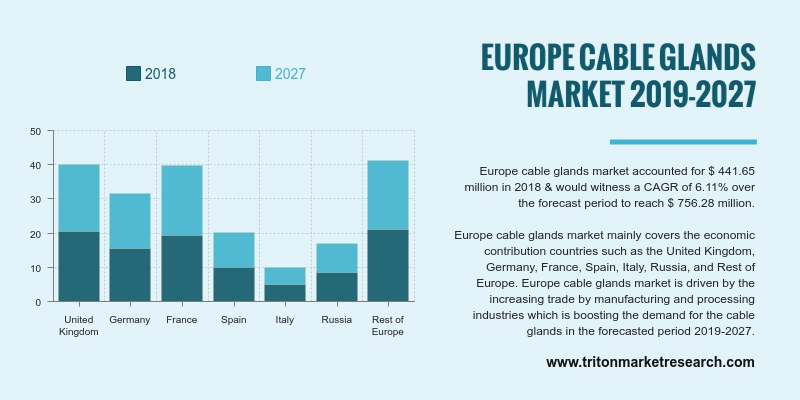
A study by Triton on the Europe market for cable glands depicts the industry would grow at a steady pace in terms of revenue, with a CAGR of 6.11% throughout the forecast period of 2019-2027.
The countries reviewed in the report on the European cable glands market are:
• The United Kingdom
• France
• Germany
• Spain
• Russia
• Italy
• Rest of Europe
Report Scope Can Be Customized Per Your Requirements. Request for Customization
Government initiatives, such as ‘Horizon 2020’ and ‘Europe 2020’, along with the manufacturing activity, are fueling the demand for cable connectors in Europe. Thus, the increase in trade by manufacturing & processing industries has boosted the demand for cable glands in the European region, driving the growth of the cable glands market in the region during the forecasting years.
The increased penetration into Industry 4.0 and ICT, coupled with the increased R&D activities, are driving the growth of the market for cable glands in the region. The establishment of new companies has led to Europe adopting green technologies. Also, companies are investing heavily in the market. Thus, the green technologies being adopted in Europe, along with the growth in the region’s residential sector, are also the factors aiding the European cable connector market.
In the United Kingdom, the advancements in technology are expected to boost the market for cable glands in the coming years. Further, the growth in demand for food processing, marine and other industries has raised the demand for cable glands, thereby propelling the growth of the UK’s cable glands market in the forecasted years.
Headquartered in Kernen, Germany, Jacob GmbH is a renowned company manufacturing cable entry systems. It is involved in the development, manufacture and distribution of plastic, brass and stainless steel cable glands. The company offers cable entry systems, cable marking systems and sealing grommets, among others, are some of the company’s product offerings. Established in 1992, Jacob GmbH has an employee strength of 200 people.

Market Segmented By Type, Appl ..
VIEW REPORT
Market By Raw Material, End-us ..
VIEW REPORT
Market by Type, Raw Material, ..
VIEW REPORT
Market by Technology, Type, En ..
VIEW REPORT
Market by Function, Product Ty ..
VIEW REPORT
Market by Product Type, Applic ..
VIEW REPORT
Market by Product, Industry Ve ..
VIEW REPORT
Market by Type, Material, Indu ..
VIEW REPORT1. EUROPE CABLE GLANDS MARKET – SUMMARY
2. INDUSTRY OUTLOOK
2.1. MARKET DEFINITION
2.2. KEY INSIGHTS
2.2.1.
RISING DEMAND FOR HAZARDOUS CABLE GLANDS
2.2.2.
SWELLING DEMAND FOR CABLE CONNECTORS IN THE AEROSPACE SECTOR
2.3. PORTER’S FIVE FORCES ANALYSIS
2.3.1.
THREAT OF NEW ENTRANTS
2.3.2.
THREAT OF SUBSTITUTE
2.3.3.
BARGAINING POWER OF SUPPLIERS
2.3.4.
BARGAINING POWER OF BUYERS
2.3.5.
THREAT OF COMPETITIVE RIVALRY
2.4. KEY IMPACT ANALYSIS
2.4.1.
COST
2.4.2.
SCALABILITY
2.4.3.
EASE OF USE
2.5. MARKET ATTRACTIVENESS INDEX
2.6. VENDOR SCORECARD
2.7. MARKET DRIVERS
2.7.1.
GOVERNMENT REGULATIONS FUEL THE DEMAND FOR CABLE GLANDS
2.7.2.
RESTORATION OF ELECTRICAL NETWORKS IN SEVERAL REGIONS
2.7.3.
RISE IN CONSTRUCTION UNDERTAKINGS IN DEVELOPING REGIONS
2.7.4.
WIDE ADOPTION OF AUTOMATION
2.8. MARKET RESTRAINTS
2.8.1.
VARIABILITY IN RAW MATERIAL PRICES
2.9. MARKET OPPORTUNITIES
2.9.1.
EMERGING GROWTH IN BUDDING MARKETS
2.9.2.
SURGE IN COUNT OF DATA CENTERS
2.10. MARKET CHALLENGES
2.10.1.
SUSPENSION OF THE LOCAL MARKETS
3. EUROPE CABLE GLANDS MARKET OUTLOOK – BY TYPE
3.1. INDUSTRIAL
3.2. HAZARDOUS
3.2.1.
INCREASED SAFETY
3.2.2.
FLAME-PROOF
3.2.3.
EMC CABLE GLANDS
3.2.4.
OTHERS
4. EUROPE CABLE GLANDS MARKET OUTLOOK – BY CABLE
TYPE
4.1. ARMORED
4.2. UNARMORED
5. EUROPE CABLE GLANDS MARKET OUTLOOK – BY
MATERIAL
5.1. BRASS
5.2. STAINLESS STEEL
5.3. PLASTIC/NYLON
5.4. OTHERS
6. EUROPE CABLE GLANDS MARKET OUTLOOK – BY
APPLICATION
6.1. OIL & GAS
6.2. MINING
6.3. AEROSPACE
6.4. MANUFACTURING & PROCESSING
6.5. CHEMICAL
6.6. OTHERS
7. EUROPE CABLE GLANDS MARKET – REGIONAL OUTLOOK
7.1. EUROPE
7.1.1.
UNITED KINGDOM
7.1.2.
GERMANY
7.1.3.
FRANCE
7.1.4.
SPAIN
7.1.5.
ITALY
7.1.6.
RUSSIA
7.1.7.
REST OF EUROPE
8. COMPETITIVE LANDSCAPE
8.1. ABB LTD.
8.2. AMPHENOL CORPORATION
8.3. EATON CORPORATION
8.4. EMERSON ELECTRIC CO.
8.5. HUBBEL INCORPORATED
8.6. THOMAS & BETTS
8.7. CMP PRODUCTS LTD.
8.8. CORTEM S.p.A
8.9. BARTEC
8.10. JACOB GMBH
8.11. SEALCON LLC
8.12. R. STAHL AG
9. METHODOLOGY & SCOPE
9.1. RESEARCH SCOPE
9.2. SOURCES OF DATA
9.3. RESEARCH METHODOLOGY
TABLE 1: EUROPE CABLE GLANDS MARKET, BY COUNTRY, 2019-2027 (IN $
MILLION)
TABLE 2: MARKET ATTRACTIVENESS INDEX
TABLE 3: VENDOR SCORECARD
TABLE 4: EUROPE CABLE GLANDS MARKET, BY TYPE, 2019-2027 (IN $ MILLION)
TABLE 5: EUROPE CABLE GLANDS MARKET, BY HAZARDOUS, 2019-2027 (IN $
MILLION)
TABLE 6: EUROPE CABLE GLANDS MARKET, BY CABLE TYPE, 2019-2027 (IN $
MILLION)
TABLE 7: EUROPE CABLE GLANDS MARKET, BY MATERIAL, 2019-2027 (IN $
MILLION)
TABLE 8: EUROPE CABLE GLANDS MARKET, BY APPLICATION, 2019-2027 (IN $
MILLION)
TABLE 9: EUROPE CABLE GLANDS MARKET, BY COUNTRY, 2019-2027 (IN $
MILLION)
FIGURE 1: EUROPE CABLE GLANDS MARKET, BY TYPE, 2018 & 2027 (IN %)
FIGURE 2: PORTER’S FIVE FORCES ANALYSIS
FIGURE 3: KEY BUYING IMPACT ANALYSIS
FIGURE 4: EUROPE CABLE GLANDS MARKET, BY INDUSTRIAL, 2019-2027 (IN $
MILLION)
FIGURE 5: EUROPE CABLE GLANDS MARKET, BY HAZARDOUS, 2019-2027 (IN $
MILLION)
FIGURE 6: EUROPE CABLE GLANDS MARKET, BY INCREASED SAFETY, 2019-2027 (IN
$ MILLION)
FIGURE 7: EUROPE CABLE GLANDS MARKET, BY FLAME-PROOF, 2019-2027 (IN $
MILLION)
FIGURE 8: EUROPE CABLE GLANDS MARKET, BY EMC CABLE GLANDS, 2019-2027 (IN
$ MILLION)
FIGURE 9: EUROPE CABLE GLANDS MARKET, BY OTHERS, 2019-2027 (IN $ MILLION)
FIGURE 10: EUROPE CABLE GLANDS MARKET, BY ARMORED, 2019-2027 (IN $
MILLION)
FIGURE 11: EUROPE CABLE GLANDS MARKET, BY UNARMORED, 2019-2027 (IN $
MILLION)
FIGURE 12: EUROPE CABLE GLANDS MARKET, BY BRASS, 2019-2027 (IN $
MILLION)
FIGURE 13: EUROPE CABLE GLANDS MARKET, BY STAINLESS STEEL, 2019-2027 (IN
$ MILLION)
FIGURE 14: EUROPE CABLE GLANDS MARKET, BY PLASTIC/NYLON, 2019-2027 (IN $
MILLION)
FIGURE 15: EUROPE CABLE GLANDS MARKET, BY OTHERS, 2019-2027 (IN $
MILLION)
FIGURE 16: EUROPE CABLE GLANDS MARKET, BY OIL & GAS, 2019-2027 (IN $
MILLION)
FIGURE 17: EUROPE CABLE GLANDS MARKET, BY MINING, 2019-2027 (IN $
MILLION)
FIGURE 18: EUROPE CABLE GLANDS MARKET, BY AEROSPACE, 2019-2027 (IN $
MILLION)
FIGURE 19: EUROPE CABLE GLANDS MARKET, BY MANUFACTURING & PROCESSING,
2019-2027 (IN $ MILLION)
FIGURE 20: EUROPE CABLE GLANDS MARKET, BY CHEMICAL, 2019-2027 (IN $
MILLION)
FIGURE 21: EUROPE CABLE GLANDS MARKET, BY OTHERS, 2019-2027 (IN $
MILLION)
FIGURE 22: EUROPE CABLE GLANDS MARKET, REGIONAL OUTLOOK, 2018 & 2027
(IN %)
FIGURE 23: UNITED KINGDOM CABLE GLANDS MARKET, 2019-2027 (IN $ MILLION)
FIGURE 24: GERMANY CABLE GLANDS MARKET, 2019-2027 (IN $ MILLION)
FIGURE 25: FRANCE CABLE GLANDS MARKET, 2019-2027 (IN $ MILLION)
FIGURE 26: SPAIN CABLE GLANDS MARKET, 2019-2027 (IN $ MILLION)
FIGURE 27: ITALY CABLE GLANDS MARKET, 2019-2027 (IN $ MILLION)
FIGURE 28: RUSSIA CABLE GLANDS MARKET, 2019-2027 (IN $ MILLION)
FIGURE 29: REST OF EUROPE CABLE GLANDS MARKET, 2019-2027 (IN $ MILLION)