

Market By Fuel Type, Power, Application, End-user, And Geography | Forecast 2019-2027
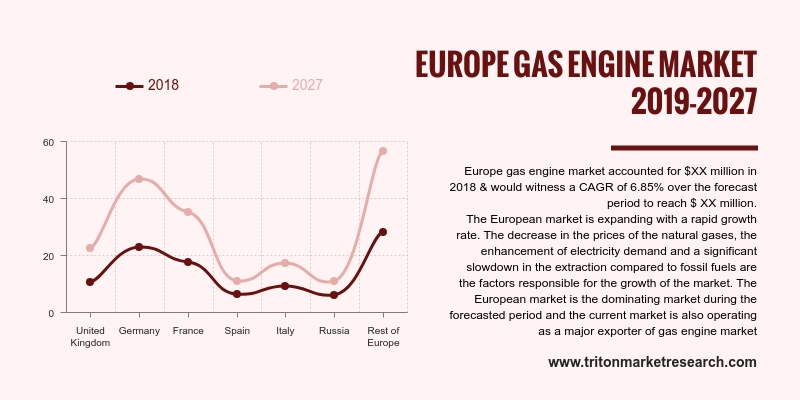
Triton’s research shows the European gas engine market to grow at a stable pace in terms of revenue, at a CAGR of 6.85%, during the forecast period 2019-2027.
The countries scrutinized in the Europe market for gas engines are:
• Russia
• Germany
• Italy
• France
• Spain
• The United Kingdom
• Rest of Europe

Report scope can be customized per your requirements. Request For Customization
Germany accounts for the majority of the share in the overall gas engine market in Europe. The country provides feed-in tariffs in the biogas segment – the key factor that aids in market expansion. Germany is the largest country for the biogas market, with around 7000 gas engines. Also, there are abundant resources available for the development of the gas engine market.
To act upon its ambitious goals of climate protection, the country has been planning to reduce its GHG emission levels by 2050, by about 80% to 95% from 1990. The increasing share of natural gas in the country’s energy mix would also help Germany to achieve these goals.
In addition, Germany houses several market giants in the automobile sector, such as Volkswagen, that have been encouraging the adoption of natural gas vehicles in the country. There has been an increase in the number of CNG vehicles being registered in the country each month since July 2017. This factor has been instrumental in raising the gas engine demand in Germany. Another factor influencing the demand is that the country is a pioneer in the entire European region for the development of renewables, energy storage, and electric vehicles.
Clarke Energy is a world-renowned brand in the energy sector. It distributes several power products and offers related services. It offers various types of engines such as gas engines, gas engine control, used gas engines, diesel gensets, and ancillary equipment are the various types of engines the company offers. The company also offers various types of gas, such as natural gas, coal gas, biogas, special gas, APG, and flare gas. Clarke Energy has its headquarters in Liverpool, the United Kingdom. In September 2018, the company installed its first biogas upgrading plant in France.
1. EUROPE
GAS ENGINE MARKET – SUMMARY
2. INDUSTRY
OUTLOOK
2.1. MARKET
DEFINITION
2.2. KEY
INSIGHTS
2.2.1. EUROPE
DOMINATES THE OVERALL MARKET
2.2.2. ADVENT
OF DUAL FUEL ENGINES
2.2.3. CONSUMPTION
OF ALTERNATE GASES AS FUELS
2.3. PORTER’S
FIVE FORCES ANALYSIS
2.3.1. THREAT
OF NEW ENTRANTS
2.3.2. THREAT
OF SUBSTITUTE
2.3.3. BARGAINING
POWER OF SUPPLIERS
2.3.4. BARGAINING
POWER OF BUYERS
2.3.5. THREAT
OF COMPETITIVE RIVALRY
2.4. KEY
IMPACT ANALYSIS
2.4.1. COST
2.4.2. EFFICIENCY
2.4.3. EMISSION
2.4.4. MAINTENANCE
2.4.5. FLEXIBILITY
2.5. MARKET
ATTRACTIVENESS INDEX
2.6. VENDOR
SCORECARD
2.7. REGULATORY
FRAMEWORK
2.8. MARKET
DRIVERS
2.8.1. DECREASE
IN GAS PRICES
2.8.2. GROWING
ELECTRICITY DEMAND WORLDWIDE
2.8.3. SURGE
IN ECOLOGICAL CONCERNS
2.8.4. INDUSTRIAL
EXPANSION LEADING TO ENVIRONMENTAL POWER GENERATION
2.9. MARKET
RESTRAINTS
2.9.1. ABNORMALITIES
IN NATURAL GAS RESERVES & PROVISIONS DUE TO REGIONAL INSTABILITY
2.9.2. RISE
IN SAFETY CONCERNS
2.9.3. PRICE
DISPARITY AMONG FUELS
2.10. MARKET
OPPORTUNITIES
2.10.1.
EMERGENT INCLINATION TOWARDS
DISTRIBUTED POWER GENERATION
2.10.2.
ADVENT OF GAS-FIRED POWER
PLANTS
2.11. MARKET
CHALLENGES
2.11.1.
DIMINISHING NATURAL GAS
RESERVES
2.11.2.
FIRM REGULATIONS LEVIED BY
AUTHORITIES
3. EUROPE
GAS ENGINE MARKET OUTLOOK – BY FUEL TYPE
3.1. NATURAL
GAS
3.2. SPECIAL
GAS
3.3. OTHER
GAS
4. EUROPE
GAS ENGINE MARKET OUTLOOK – BY POWER
4.1. 0.5
MW-1.0 MW
4.2. 1.0-2.0
MW
4.3. 2.0-5.0
MW
4.4. 5.0
MW-10.0 MW
4.5. 10.0
MW-20.0 MW
5. EUROPE
GAS ENGINE MARKET OUTLOOK – BY APPLICATION
5.1. POWER
GENERATION
5.2. CO-GENERATION
5.3. OTHER
APPLICATIONS
6. EUROPE
GAS ENGINE MARKET OUTLOOK – BY END-USER
6.1. UTILITIES
6.2. MANUFACTURING
6.3. OIL
& GAS
6.4. TRANSPORTATION
6.5. OTHER
END-USERS
7. EUROPE
GAS ENGINE MARKET – REGIONAL OUTLOOK
7.1. UNITED
KINGDOM
7.2. GERMANY
7.3. FRANCE
7.4. SPAIN
7.5. ITALY
7.6. RUSSIA
7.7. REST
OF EUROPE
8. COMPETITIVE
LANDSCAPE
8.1. 3W-INTERNATIONAL
GMBH
8.2. CATERPILLAR
INC.
8.3. CUMMINS INC.
8.4. CHINA
YUCHAI INTERNATIONAL LTD.
8.5. CLARKE
ENERGY
8.6. DEUTZ
AG
8.7. DRESSER-RAND
GROUP INC.
8.8. DOOSAN
INFRACORE CO. LTD.
8.9. FAIRBANKS
MORSE ENGINES
8.10. GENERAL
ELECTRIC COMPANY (INNIO)
8.11. HYUNDAI
HEAVY INDUSTRIES CO. LTD.
8.12. IHI
CORPORATION
8.13. KAWASAKI
HEAVY INDUSTRIES LTD.
8.14. MAN
SE
8.15. MITSUBISHI
HEAVY INDUSTRIES LTD.
8.16. WÄRTSILÄ
9. METHODOLOGY
& SCOPE
9.1. RESEARCH
SCOPE
9.2. SOURCES
OF DATA
9.3. RESEARCH
METHODOLOGY
TABLE 1: EUROPE GAS
ENGINE MARKET, BY COUNTRY, 2019-2027 (IN $ MILLION)
TABLE 2: VENDOR
SCORECARD
TABLE 3: REGULATORY
FRAMEWORK
TABLE 4: NATURAL GAS
PRICES (DOLLARS PER THOUSAND CUBIC FEET)
TABLE 5: COMPARISON OF
CARBON DIOXIDE EMISSION LEVELS FOR DIFFERENT FUELS (1990-2040) (MILLION METRIC
TONS)
TABLE 6: EUROPE GAS
ENGINE MARKET, BY FUEL TYPE, 2019-2027 (IN $ MILLION)
TABLE 7: EUROPE GAS
ENGINE MARKET, BY POWER, 2019-2027 (IN $ MILLION)
TABLE 8: EUROPE GAS
ENGINE MARKET, BY APPLICATION, 2019-2027 (IN $ MILLION)
TABLE 9: EUROPE GAS
ENGINE MARKET, BY END-USER, 2019-2027 (IN $ MILLION)
TABLE 10: EUROPE GAS
ENGINE MARKET, BY COUNTRY, 2019-2027 (IN $ MILLION)
FIGURE 1: EUROPE GAS
ENGINE MARKET, BY FUEL TYPE, 2018 & 2027 (IN %)
FIGURE 2: PORTER’S FIVE
FORCES ANALYSIS
FIGURE 3: KEY BUYING
IMPACT ANALYSIS
FIGURE 4: MARKET
ATTRACTIVENESS INDEX
FIGURE 5: EUROPE GAS ENGINE
MARKET, BY NATURAL GAS, 2019-2027 (IN $ MILLION)
FIGURE 6: EUROPE GAS
ENGINE MARKET, BY SPECIAL GAS, 2019-2027 (IN $ MILLION)
FIGURE 7: EUROPE GAS
ENGINE MARKET, BY OTHER GAS, 2019-2027 (IN $ MILLION)
FIGURE 8: EUROPE GAS
ENGINE MARKET, BY 0.5 MW-1.0 MW, 2019-2027 (IN $ MILLION)
FIGURE 9: EUROPE GAS
ENGINE MARKET, BY 1.0-2.0 MW, 2019-2027 (IN $ MILLION)
FIGURE 10: EUROPE GAS
ENGINE MARKET, BY 2.0-5.0 MW, 2019-2027 (IN $ MILLION)
FIGURE 11: EUROPE GAS
ENGINE MARKET, BY 5.0 MW-10.0 MW, 2019-2027 (IN $ MILLION)
FIGURE 12: EUROPE GAS
ENGINE MARKET, BY 10.0 MW-20.0 MW, 2019-2027 (IN $ MILLION)
FIGURE 13: EUROPE GAS
ENGINE MARKET, BY POWER GENERATION, 2019-2027 (IN $ MILLION)
FIGURE 14: EUROPE GAS
ENGINE MARKET, BY CO-GENERATION, 2019-2027 (IN $ MILLION)
FIGURE 15: EUROPE GAS
ENGINE MARKET, BY OTHER APPLICATIONS, 2019-2027 (IN $ MILLION)
FIGURE 16: EUROPE GAS
ENGINE MARKET, BY UTILITIES, 2019-2027 (IN $ MILLION)
FIGURE 17: EUROPE GAS
ENGINE MARKET, BY MANUFACTURING, 2019-2027 (IN $ MILLION)
FIGURE 18: EUROPE GAS
ENGINE MARKET, BY OIL & GAS, 2019-2027 (IN $ MILLION)
FIGURE 19: EUROPE GAS
ENGINE MARKET, BY TRANSPORTATION, 2019-2027 (IN $ MILLION)
FIGURE 20: EUROPE GAS
ENGINE MARKET, BY OTHER END-USERS, 2019-2027 (IN $ MILLION)
FIGURE 21: EUROPE GAS
ENGINE MARKET, REGIONAL OUTLOOK, 2018 & 2027 (IN %)
FIGURE 22: UNITED
KINGDOM GAS ENGINE MARKET, 2019-2027 (IN $ MILLION)
FIGURE 23: GERMANY GAS
ENGINE MARKET, 2019-2027 (IN $ MILLION)
FIGURE 24: FRANCE GAS
ENGINE MARKET, 2019-2027 (IN $ MILLION)
FIGURE 25: SPAIN GAS ENGINE
MARKET, 2019-2027 (IN $ MILLION)
FIGURE 26: ITALY GAS
ENGINE MARKET, 2019-2027 (IN $ MILLION)
FIGURE 27: RUSSIA GAS
ENGINE MARKET, 2019-2027 (IN $ MILLION)
FIGURE 28: REST OF
EUROPE GAS ENGINE MARKET, 2019-2027 (IN $ MILLION)