


Market By New Software Licenses & Support Services, Deployment Type, Verticals, End User And Geography | Forecast 2019-2027
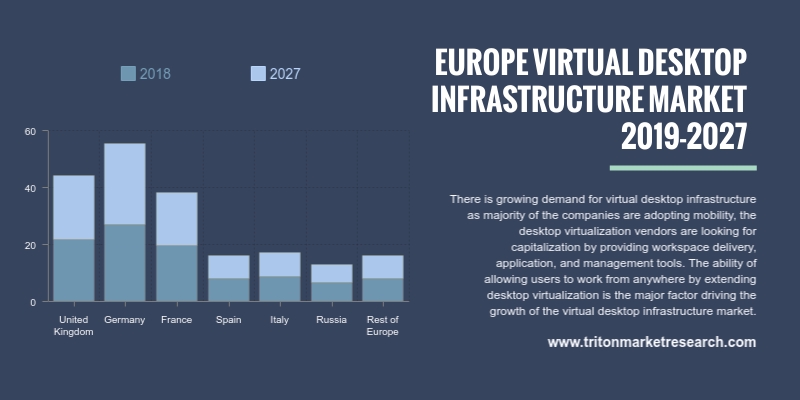
Triton Market Research has estimated the Europe virtual desktop infrastructure market to show an upward trend in terms of revenue and grow rapidly with a CAGR of 9.09% in the forecasting years 2019-2027.
The countries analyzed for the Europe virtual desktop infrastructure market are:
O The United Kingdom
O France
O Italy
O Spain
O Germany
O Russia
O Rest of Europe
Report scope can be customized per your requirements. Request For Customization
The rising trend of workplace flexibility has proven to be advantageous for the growth of the virtual desktop infrastructure market in Europe. Telecommuting, part-time working, flexible scheduling and freelancing, among others are the various modes used by employees to work that call for a proper infrastructure. This demand can be fulfilled by the adoption of a VDI system. The increasing adoption of cloud computing technology across several businesses is driving the growth of the VDI market, since the cloud platform provides flexibility and helps reduce costs.
‘Bring your own device’ (BYOD) is a concept in which employees have the flexibility of working from their own devices such as laptops, smartphones, tablets, etc. The implementation of BYOD policies in the organizations worldwide has not only proven to be a cost-saving measure for the organizations, but has also helped increase the productivity of the employees. These factors are responsible for the growth of the European virtual desktop infrastructure market.
Incompatibility concerns with respect to VDI is one of the aspects that may hinder the growth of the global virtual desktop infrastructure market over the forecast years. Deploying a solution needs a complex back-end infrastructure along with a robust network and understanding of all principles. In addition, VDI deployment is an expensive affair, considering its massive client-to-host ratios. With the availability of alternatives such as personal virtualization and remote desktop service (RDS), the adoption of virtual desktop infrastructure across various verticals is being hampered.
The virtual desktop infrastructure market report includes key information about the market definition, key insights regarding the industry, Porter’s five force analysis, evolution & transition of the virtual desktop infrastructure, key impact analysis, vendor scorecard, industry components, market attractiveness index, regulatory framework and key market strategies.


Market by Technology (Data ana ..
VIEW REPORT1. VIRTUAL
DESKTOP INFRASTRUCTURE MARKET - SUMMARY
2. INDUSTRY
OUTLOOK
2.1. MARKET
DEFINITION
2.2. KEY
INSIGHTS
2.2.1. IT
INFRASTRUCTURE BECOMING CHEAP DUE TO INNOVATIONS
2.2.2. LARGE
ENTERPRISES TO DOMINATE THE END USER SEGMENT
2.2.3. FINANCIAL
SERVICES IS THE FASTEST GROWING VERTICAL
2.3. EVOLUTION
& TRANSITION OF VIRTUAL DESKTOP INFRASTRUCTURE
2.4. PORTER’S
FIVE FORCE ANALYSIS
2.4.1. THREAT
OF NEW ENTRANTS
2.4.2. THREAT
OF SUBSTITUTES
2.4.3. BARGAINING
POWER OF SUPPLIERS
2.4.4. BARGAINING
POWER OF BUYERS
2.4.5. THREAT
OF COMPETITIVE RIVALRY
2.5. KEY
IMPACT ANALYSIS
2.5.1. COMPANY
BACKGROUND & EXPERIENCE
2.5.2. COST
2.5.3. CUSTOMIZABILITY
2.5.4. SCALABILITY
2.6. MARKET
ATTRACTIVENESS INDEX
2.7. VENDOR
SCORECARD
2.8. INDUSTRY
COMPONENTS
2.8.1. SUPPLIERS
2.8.2. SERVICE
DEVELOPMENT
2.8.3. CLOUD
SERVICES & MANAGEMENT
2.8.4. END
USERS
2.9. REGULATORY
FRAMEWORK
2.10.
KEY MARKET STRATEGIES
2.10.1.
RESEARCH & PRODUCT LAUNCH
2.10.2.
MERGER & ACQUISITION
2.10.3.
PARTNERSHIP
2.11.
MARKET DRIVERS
2.11.1.
RISING WORKPLACE FLEXIBILITY
2.11.2.
INCREASED ADOPTION OF CLOUD
SERVICES
2.11.3.
RISE IN BRING YOUR OWN DEVICE
(BYOD) CULTURE
2.12.
MARKET RESTRAINTS
2.12.1.
PROBLEMS ASSOCIATED WITH
TRAINING AND EDUCATION
2.12.2.
PRIVACY CONCERNS
2.12.3.
BANDWIDTH DEMAND TOO HIGH
2.13.
MARKET OPPORTUNITIES
2.13.1.
RISING ADOPTION OF CLOUD-BASED
VIRTUAL DESKTOP INFRASTRUCTURE
2.13.2.
DESKTOP AS A SERVICE: A RISING
TREND
2.14.
MARKET CHALLENGES
2.14.1.
COMPATIBILITY ISSUES &
INTRICATE SYSTEM
2.14.2.
RISING FREE SERVICES PROVIDED
BY COMPANIES TO INCREASE THEIR MARKET SHARE
3. VIRTUAL
DESKTOP INFRASTRUCTURE MARKET OUTLOOK - BY NEW SOFTWARE LICENSES & SUPPORT
SERVICES
3.1. NEW
SOFTWARE LICENSES
3.2. SUPPORT
SERVICES
4. VIRTUAL
DESKTOP INFRASTRUCTURE MARKET OUTLOOK - BY DEPLOYMENT TYPE
4.1. ON
PREMISE
4.2. CLOUD-BASED
5. VIRTUAL
DESKTOP INFRASTRUCTURE MARKET OUTLOOK - BY VERTICALS
5.1. INFORMATION
TECHNOLOGY
5.2. FINANCIAL
SERVICES
5.3. MANUFACTURING
5.4. LEGAL
5.5. HEALTHCARE
5.6. EDUCATION
5.7. RETAIL
5.8. PUBLIC
SECTOR/GOVERNMENT
5.9. OTHER
APPLICATIONS
6. VIRTUAL
DESKTOP INFRASTRUCTURE MARKET OUTLOOK - BY END USER
6.1. LARGE
ENTERPRISES
6.2. SMALL
AND MEDIUM ENTERPRISES
7. VIRTUAL
DESKTOP INFRASTRUCTURE MARKET - REGIONAL OUTLOOK
7.1. EUROPE
7.1.1. UNITED
KINGDOM
7.1.2. GERMANY
7.1.3. FRANCE
7.1.4. SPAIN
7.1.5. ITALY
7.1.6. RUSSIA
7.1.7. REST
OF EUROPE
8. COMPETITIVE
LANDSCAPE
8.1. HIVEIO
8.2. CISCO
SYSTEMS
8.3. CITRIX
SYSTEMS
8.4. DINCLOUD
8.5. DIZZION,
INC.
8.6. FUJIAN
CENTERM INFORMATION (CENTERM)
8.7. HEWLETT
PACKARD
8.8. HUAWEI
TECHNOLOGIES
8.9. IGEL
TECHNOLOGY
8.10.
LISTEQ
8.11.
MICROSOFT CORPORATION
8.12.
NCOMPUTING
8.13.
NETAPP
8.14.
THINSPACE TECHNOLOGY, LTD.
8.15.
VMWARE, INC.
9. METHODOLOGY
& SCOPE
9.1. RESEARCH
SCOPE
9.2. SOURCES
OF DATA
9.3. RESEARCH
METHODOLOGY
TABLE 1: EUROPE VIRTUAL DESKTOP INFRASTRUCTURE
MARKET, BY COUNTRY, 2019-2027 (IN $ MILLION)
TABLE 2: MARKET ATTRACTIVENESS INDEX
TABLE 3: VENDOR SCORECARD
TABLE 4: REGULATORY FRAMEWORK
TABLE 5: EUROPE VIRTUAL DESKTOP INFRASTRUCTURE
MARKET, BY COUNTRY, 2019-2027 (IN $ MILLION)
TABLE 6: EUROPE VIRTUAL DESKTOP INFRASTRUCTURE
MARKET, BY NEW SOFTWARE LICENSES & SUPPORT SERVICES, 2019-2027 (IN $
MILLION)
TABLE 7: EUROPE VIRTUAL DESKTOP INFRASTRUCTURE
MARKET, BY DEPLOYMENT TYPE, 2019-2027 (IN $ MILLION)
TABLE 8: EUROPE VIRTUAL DESKTOP INFRASTRUCTURE
MARKET, BY VERTICALS, 2019-2027 (IN $ MILLION)
TABLE 9: EUROPE VIRTUAL DESKTOP INFRASTRUCTURE
MARKET, BY END USER, 2019-2027 (IN $ MILLION)
FIGURE
1: EUROPE VIRTUAL DESKTOP
INFRASTRUCTURE MARKET, BY VERTICAL, 2018 & 2027 (IN %)
FIGURE
2: PORTER’S FIVE FORCE ANALYSIS
FIGURE
3: KEY BUYING IMPACT ANALYSIS
FIGURE
4: INDUSTRY COMPONENTS
FIGURE
5: WORKING OF DESKTOP AS A SERVICE
FIGURE
6: EUROPE VIRTUAL DESKTOP
INFRASTRUCTURE MARKET, BY NEW SOFTWARE LICENSES, 2019-2027 (IN $ MILLION)
FIGURE
7: EUROPE VIRTUAL DESKTOP INFRASTRUCTURE
MARKET, BY SUPPORT SERVICES, 2019-2027 (IN $ MILLION)
FIGURE
8: EUROPE VIRTUAL DESKTOP
INFRASTRUCTURE MARKET, BY ON-PREMISE, 2019-2027 (IN $ MILLION)
FIGURE
9: EUROPE VIRTUAL DESKTOP
INFRASTRUCTURE MARKET, BY CLOUD-BASED, 2019-2027 (IN $ MILLION)
FIGURE
10: EUROPE VIRTUAL DESKTOP INFRASTRUCTURE
MARKET, BY INFORMATION TECHNOLOGY, 2019-2027 (IN $ MILLION)
FIGURE
11: EUROPE VIRTUAL DESKTOP INFRASTRUCTURE
MARKET, BY FINANCIAL SERVICES, 2019-2027 (IN $ MILLION)
FIGURE
12: EUROPE VIRTUAL DESKTOP INFRASTRUCTURE
MARKET, BY MANUFACTURING, 2019-2027 (IN $ MILLION)
FIGURE
13: EUROPE VIRTUAL DESKTOP INFRASTRUCTURE
MARKET, BY LEGAL, 2019-2027 (IN $ MILLION)
FIGURE
14: EUROPE VIRTUAL DESKTOP INFRASTRUCTURE
MARKET, BY HEALTHCARE, 2019-2027 (IN $ MILLION)
FIGURE
15: EUROPE VIRTUAL DESKTOP INFRASTRUCTURE
MARKET, BY EDUCATION, 2019-2027 (IN $ MILLION)
FIGURE
16: EUROPE VIRTUAL DESKTOP INFRASTRUCTURE
MARKET, BY RETAIL, 2019-2027 (IN $ MILLION)
FIGURE
17: EUROPE VIRTUAL DESKTOP INFRASTRUCTURE
MARKET, BY PUBLIC SECTOR/GOVERNMENT, 2019-2027 (IN $ MILLION)
FIGURE
18: EUROPE VIRTUAL DESKTOP INFRASTRUCTURE
MARKET, BY OTHER APPLICATIONS, 2019-2027 (IN $ MILLION)
FIGURE
19: EUROPE VIRTUAL DESKTOP INFRASTRUCTURE
MARKET, BY LARGE ENTERPRISES, 2019-2027 (IN $ MILLION)
FIGURE
20: EUROPE VIRTUAL DESKTOP INFRASTRUCTURE
MARKET, BY SMALL & MEDIUM ENTERPRISES, 2019-2027 (IN $ MILLION)
FIGURE
21: EUROPE VIRTUAL DESKTOP INFRASTRUCTURE
MARKET, REGIONAL OUTLOOK, 2018 & 2027 (IN %)
FIGURE
22: UNITED KINGDOM VIRTUAL DESKTOP
INFRASTRUCTURE MARKET, 2019-2027 (IN $ MILLION)
FIGURE
23: GERMANY VIRTUAL DESKTOP
INFRASTRUCTURE MARKET, 2019-2027 (IN $ MILLION)
FIGURE
24: FRANCE VIRTUAL DESKTOP INFRASTRUCTURE
MARKET, 2019-2027 (IN $ MILLION)
FIGURE
25: SPAIN VIRTUAL DESKTOP INFRASTRUCTURE
MARKET, 2019-2027 (IN $ MILLION)
FIGURE
26: ITALY VIRTUAL DESKTOP INFRASTRUCTURE
MARKET, 2019-2027 (IN $ MILLION)
FIGURE
27: RUSSIA VIRTUAL DESKTOP INFRASTRUCTURE
MARKET, 2019-2027 (IN $ MILLION)
FIGURE
28: REST OF EUROPE VIRTUAL DESKTOP
INFRASTRUCTURE MARKET, 2019-2027 (IN $ MILLION)