


Market By Products, Services And Geography | Forecast 2019-2027
As per Triton's research report, the Middle East and African smart home market is anticipated to upsurge with a CAGR of 16.55% in the forecasting years of 2019-2027.
The countries that have been analyzed in the smart home market in MEA are:
• The United Arab Emirates
• Turkey
• Saudi Arabia
• South Africa
• Rest of Middle East & Africa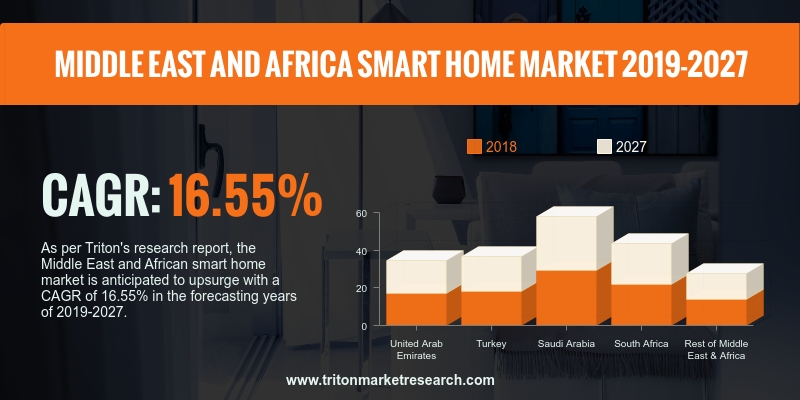
Report scope can be customized per your requirements. Request For Customization
In 2018, the majority of the market share was captured by Saudi Arabia in the Middle East and Africa smart home market. On the other hand, Turkey is anticipated to be the fastest-growing country in the market in the forecast period. The main driver responsible for the growth of the smart home market is the region’s focus on the tourism and real estate market. The real estate industry in the Middle East is one of the fastest-growing sectors around the globe. Foreign real estate developers have invested huge sums of money into places such as Saudi Arabia Oman, Qatar, Dubai and other countries in this region, which has propelled the growth of the smart home market in this region, which is also a great tourist destination. This is majorly going to help the growth of the smart home market in this region. Saudi Arabia is endowed with huge petroleum deposits and forms part of G20 nations. The country has a well-developed real estate and is an excellent tourist destination. Due to this the smart home solutions such as smart metering, Lighting controllers, Energy Management and Security will tremendous growth in the region.
LG Electronics, Inc. is a South Korean consumer electronics company. The company’s product portfolio comprises refrigerators, washing machines, vacuum cleaners, cooking appliances, mobile telecommunication products, television sets, personal computers, in-vehicle infotainment products, HVAC or heating, ventilation and air conditioning products, among others. LGE classifies its business operations into six reportable segments: Home Entertainment (HE); Home Appliance and Air Solution (H&A); Mobile Communications (MC); LG Innotek Co., Ltd. and its subsidiaries (Innotek); Vehicle Components (VC); and others. The company operates in Europe, Asia, the Americas, the Middle East and Africa and the Commonwealth of Independent States (CIS).


Market by Technology (Data ana ..
VIEW REPORT1. MIDDLE EAST AND AFRICA SMART HOME MARKET -
SUMMARY
2. INDUSTRY OUTLOOK
2.1. MARKET DEFINITION
2.2. KEY INSIGHTS
2.2.1. INCREASE IN THE ADOPTION OF ELECTRONIC
GADGETS
2.2.2. CLOUD TECHNOLOGY HELPS IN THE GROWTH OF THE
MARKET
2.2.3. INCREASED ADOPTION OF SMART HOMES
2.3. EVOLUTION & TRANSITION OF SMART HOME
2.4. PORTER’S FIVE FORCE ANALYSIS
2.4.1. THREAT OF NEW ENTRANTS
2.4.2. THREAT OF SUBSTITUTE
2.4.3. BARGAINING POWER OF SUPPLIERS
2.4.4. BARGAINING POWER OF BUYERS
2.4.5. THREAT OF COMPETITIVE RIVALRY
2.5. KEY IMPACT ANALYSIS
2.5.1. COST
2.5.2. DATA SECURITY
2.5.3. COMFORT
2.6. MARKET ATTRACTIVENESS INDEX
2.7. VENDOR SCORECARD
2.8. INDUSTRY COMPONENTS
2.9. MARKET DRIVERS
2.9.1. GROWTH IN THE AGING POPULATION
2.9.2. GROWTH IN THE INTERNET OF THINGS (IOT)
DEVICES
2.9.3. INCREASE IN THE URBANIZATION AND
INFRASTRUCTURE PROJECTS
2.9.4. GOVERNMENTAL INITIATIVES
2.10. MARKET RESTRAINTS
2.10.1. COMPLEX INSTALLATION PROCEDURE OF SMART
DEVICES
2.10.2. PROBLEMS WITH DATA MANAGEMENT
2.10.3. HIGH PRICE OF SMART HOME PROJECTS
2.10.4. PRIVACY CONCERNS
2.11. MARKET OPPORTUNITIES
2.11.1. DEMAND FROM URBAN SECURITY
2.11.2. GROWTH OF SMART CITY PROJECTS
2.12. MARKET CHALLENGES
2.12.1. LOW AWARENESS ABOUT THE MARKET
2.12.2. LACK OF STANDARDIZATION AND PROBLEMS WITH
INTEROPERABILITY
3. MIDDLE EAST AND AFRICA SMART HOME MARKET
OUTLOOK - BY PRODUCTS
3.1. SECURITY
3.2. HVAC
3.3. LIGHTING CONTROLLERS
3.4. ENTERTAINMENT
3.5. ENERGY MANAGEMENT
3.6. HOME HEALTH
3.7. OTHERS
4. MIDDLE EAST AND AFRICA SMART HOME MARKET
OUTLOOK - BY SERVICES
4.1. INSTALLATION & REPAIR
4.2. CUSTOMIZATION
5. MIDDLE EAST AND AFRICA SMART HOME MARKET -
REGIONAL OUTLOOK
5.1. THE UNITED ARAB EMIRATES
5.2. TURKEY
5.3. SAUDI ARABIA
5.4. SOUTH AFRICA
5.5. REST OF MIDDLE EAST & AFRICA
6. COMPETITIVE LANDSCAPE
6.1. ABB LTD.
6.2. BLUE LINE INNOVATIONS, INC.
6.3. CENTRICA CONNECTED HOME LIMITED
6.4. CENTURY TECHNOLOGIES CORP.
6.5. CONTROL4 CORPORATION
6.6. CRESTRON ELECTRONICS, INC.
6.7. EE LIMITED
6.8. EMERSON ELECTRIC, CO.
6.9. HONEYWELL INTERNATIONAL, INC.
6.10. JOHNSON CONTROLS, INC.
6.11. LG ELECTRONICS, INC.
6.12. SAMSUNG ELECTRONICS CO., LTD.
6.13. SCHNEIDER ELECTRIC SE
6.14. SIEMENS AG
6.15. SOLATUBE INTERNATIONAL, INC.
6.16. UNITED TECHNOLOGIES CORPORATION
6.17. VODAFONE GROUP PLC
7. RESEARCH METHODOLOGY & SCOPE
7.1. RESEARCH SCOPE & DELIVERABLES
7.2. SOURCES OF DATA
7.3. RESEARCH METHODOLOGY
TABLE 1: MIDDLE EAST AND AFRICA SMART HOME MARKET, BY COUNTRY, 2019-2027
(IN $ MILLION)
TABLE 2: TECHNOLOGIES USED IN A HOME AREA NETWORK
TABLE 3: VENDOR SCORECARD
TABLE 4: KEY COUNTRIES BY CRIME INDEX
TABLE 5: MIDDLE EAST AND AFRICA SMART HOME MARKET, BY PRODUCTS,
2019-2027 (IN $ MILLION)
TABLE 6: MIDDLE EAST AND AFRICA SMART HOME MARKET, BY SERVICES,
2019-2027 (IN $ MILLION)
TABLE 7: MIDDLE EAST AND AFRICA SMART HOME MARKET, BY COUNTRY, 2019-2027
(IN $ MILLION)
FIGURE 1: EVOLUTION OF SMART HOME MARKET
FIGURE 2: PORTER’S FIVE FORCE ANALYSIS
FIGURE 3: KEY BUYING IMPACT ANALYSIS
FIGURE 4: MARKET ATTRACTIVENESS INDEX
FIGURE 5: INDUSTRY COMPONENTS
FIGURE 6: PERCENTAGE OF URBAN POPULATION ACROSS MAJOR REGIONS, 2017
FIGURE 7: MIDDLE EAST AND AFRICA SMART HOME MARKET, BY SECURITY,
2019-2027 (IN $ MILLION)
FIGURE 8: MIDDLE EAST AND AFRICA SMART HOME MARKET, BY HVAC, 2019-2027
(IN $ MILLION)
FIGURE 9: MIDDLE EAST AND AFRICA SMART HOME MARKET, BY LIGHTING
CONTROLLERS, 2019-2027 (IN $ MILLION)
FIGURE 10: MIDDLE EAST AND AFRICA SMART HOME MARKET, BY ENTERTAINMENT,
2019-2027 (IN $ MILLION)
FIGURE 11: MIDDLE EAST AND AFRICA SMART HOME MARKET, BY ENERGY
MANAGEMENT, 2019-2027 (IN $ MILLION)
FIGURE 12: MIDDLE EAST AND AFRICA SMART HOME MARKET, BY HOME HEALTH,
2019-2027 (IN $ MILLION)
FIGURE 13: MIDDLE EAST AND AFRICA SMART HOME MARKET, BY OTHERS,
2019-2027 (IN $ MILLION)
FIGURE 14: MIDDLE EAST AND AFRICA SMART HOME MARKET, BY INSTALLATION
& REPAIR, 2019-2027 (IN $ MILLION)
FIGURE 15: MIDDLE EAST AND AFRICA SMART HOME MARKET, BY CUSTOMIZATION,
2019-2027 (IN $ MILLION)
FIGURE 16: MIDDLE EAST AND AFRICA SMART HOME MARKET, REGIONAL OUTLOOK,
2018 & 2027 (IN %)
FIGURE 17: THE UNITED ARAB EMIRATES SMART HOME MARKET, 2019-2027 (IN $
MILLION)
FIGURE 18: TURKEY SMART HOME MARKET, 2019-2027 (IN $ MILLION)
FIGURE 19: SAUDI ARABIA SMART HOME MARKET, 2019-2027 (IN $ MILLION)
FIGURE 20: SOUTH AFRICA SMART HOME MARKET, 2019-2027 (IN $ MILLION)
FIGURE 21: REST OF MIDDLE EAST & AFRICA SMART HOME MARKET, 2019-2027
(IN $ MILLION)