


Market By Display Type, Technology, Application, Industry Vertical, And Geography | Forecast 2019-2027
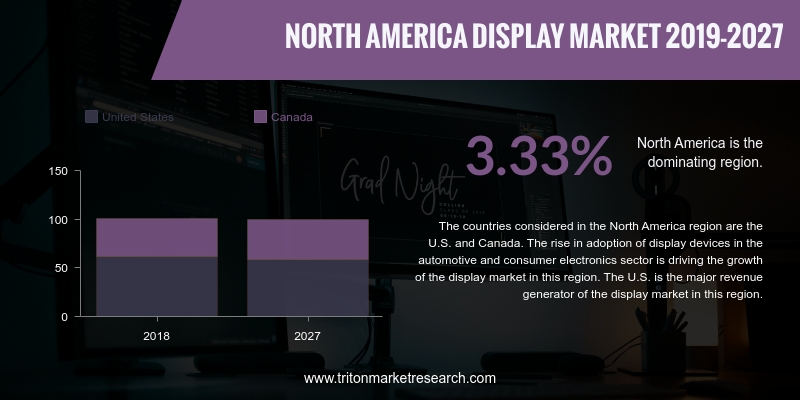
The North America display market, as stated by Triton in its research report, is anticipated to witness a growth in revenue, with a CAGR of 3.33% in estimated years of 2019 to 2027.
The countries studied in the North American display market are:
• The United States
• Canada
Report scope can be customized per your requirements. Request For Customization
North America is a technologically advanced region with a highly developed consumer electronics industry, owing to which, there is massive penetration of consumer electronics in the majority of the households in the region.
The development of smart offices and smart homes, as a result of the advancements in technology, has led to a rise in the demand for consumer electronic products such as smart TVs, smart refrigerators, smart air conditioners, and more. It can thus be said that the rise in the disposable incomes of people, increasing demand for consumer electronics, and the shift in consumer preferences towards smart homes and smart offices are primarily driving industry growth.
The increased innovations and interconnectivity among consumer electronic products have given rise to smarter consumer electronics. The applications of VR technology, IoT solutions, and robotics in the manufacturing of consumer electronics, which results in high-efficiency products with low manufacturing costs, have significantly benefited the North American consumer electronics industry.
Kent Displays, Inc. is a company well-known for its unique display technology called “eWriter,” as well as for its expertise in roll-to-roll manufacturing. It is engaged in the R&D, design, and assembly of consumer-packaged goods. The company has commercialized its eWriter technology and sells it under the brand “Boogie Board.” It is a private company, and hence, has not disclosed its financial information on the public domain. The growing e-learning and consumer electronics sector provides the company with an excellent opportunity to expand its business. Kent Displays, in October 2017, launched its electronic writing tool called Blackboard. The US-based company is headquartered in Kent, Ohio.


Market by Technology (Data ana ..
VIEW REPORT1. NORTH
AMERICA DISPLAY MARKET – SUMMARY
2. INDUSTRY
OUTLOOK
2.1. MARKET
DEFINITION
2.2. KEY
INSIGHTS
2.2.1. VEHICLE
DISPLAY IS A RAPIDLY GROWING APPLICATION IN THE DISPLAY MARKET
2.2.2. FLAT-PANEL
DISPLAY IS THE LARGEST DISPLAY TYPE DURING THE FORECAST PERIOD
2.2.3. CONSUMER
ELECTRONICS IS THE LARGEST INDUSTRIAL VERTICAL USING DISPLAYS DURING THE
FORECAST PERIOD
2.3. PORTER’S
FIVE FORCES ANALYSIS
2.3.1. THREAT
OF NEW ENTRANTS
2.3.2. THREAT
OF SUBSTITUTE
2.3.3. BARGAINING
POWER OF SUPPLIERS
2.3.4. BARGAINING
POWER OF BUYERS
2.3.5. INTENSITY
OF COMPETITIVE RIVALRY
2.4. MARKET
ATTRACTIVENESS INDEX
2.5. VENDOR
SCORECARD
2.6. MARKET
DRIVERS
2.6.1. RISING
DEMAND FOR OLED DEVICES
2.6.2. INCREASING
DEMAND FOR TOUCH-BASED DEVICES
2.7. MARKET
RESTRAINTS
2.7.1. STAGNATION
IN THE GROWTH OF DESKTOP PC, NOTEBOOK, AND TABLET
2.7.2. INCREASING
COST OF CERTAIN DISPLAY TECHNOLOGIES
2.8. MARKET
OPPORTUNITIES
2.8.1. INCREASING
USE OF AR/VR DEVICES
2.9. MARKET
CHALLENGES
2.9.1. UNSTABLE
PRICING OF DISPLAY PANELS
3. DISPLAY
MARKET OUTLOOK – BY DISPLAY TYPE
3.1. FLAT-PANEL
DISPLAY
3.2. FLEXIBLE-PANEL
DISPLAY
3.3. TRANSPARENT-PANEL
DISPLAY
4. DISPLAY
MARKET OUTLOOK – BY TECHNOLOGY
4.1. OLED
4.2. QUANTUM
DOT
4.3. LED
4.4. LCD
4.5. E-PAPER
4.6. OTHER
TECHNOLOGIES
5. DISPLAY
MARKET OUTLOOK – BY APPLICATION
5.1. SMARTPHONE
& TABLET
5.2. SMART
WEARABLE
5.3. TELEVISION
& DIGITAL SIGNAGE
5.4. PC
& LAPTOP
5.5. VEHICLE
DISPLAY
5.6. OTHER
APPLICATIONS
6. DISPLAY
MARKET OUTLOOK – BY INDUSTRY VERTICAL
6.1. HEALTHCARE
6.2. CONSUMER
ELECTRONICS
6.3. BFSI
6.4. RETAIL
6.5. MILITARY
& DEFENSE
6.6. AUTOMOTIVE
6.7. OTHER
INDUSTRY VERTICALS
7. DISPLAY
MARKET – NORTH AMERICA
7.1. UNITED
STATES
7.2. CANADA
8. COMPETITIVE
LANDSCAPE
8.1. AU
OPTRONICS CORP.
8.2. CORNING
INCORPORATED.
8.3. E
INK HOLDINGS INC.
8.4. HANNSTAR
DISPLAY CORPORATION
8.5. JAPAN
DISPLAY INC.
8.6. KENT
DISPLAYS, INC.
8.7. LG
DISPLAY
8.8. NEC
DISPLAY SOLUTIONS, LTD.
8.9. SAMSUNG
ELECTRONICS CO., LTD.
8.10.
SONY CORPORATION
9. RESEARCH
METHODOLOGY & SCOPE
9.1. RESEARCH
SCOPE & DELIVERABLES
9.1.1. OBJECTIVES
OF STUDY
9.1.2. SCOPE
OF STUDY
9.2. SOURCES
OF DATA
9.2.1. PRIMARY
DATA SOURCES
9.2.2. SECONDARY
DATA SOURCES
9.3. RESEARCH
METHODOLOGY
9.3.1. EVALUATION
OF PROPOSED MARKET
9.3.2. IDENTIFICATION
OF DATA SOURCES
9.3.3. ASSESSMENT
OF MARKET DETERMINANTS
9.3.4. DATA
COLLECTION
9.3.5. DATA
VALIDATION & ANALYSIS
TABLE 1: NORTH AMERICA
DISPLAY MARKET, BY COUNTRY, 2019-2027 (IN $ BILLION)
TABLE 2: VENDOR
SCORECARD
TABLE 3: NORTH AMERICA
DISPLAY MARKET, BY DISPLAY TYPE, 2019-2027 (IN $ BILLION)
TABLE 4: NORTH AMERICA
DISPLAY MARKET, BY TECHNOLOGY, 2019-2027 (IN $ BILLION)
TABLE 5: NORTH AMERICA
DISPLAY MARKET, BY APPLICATION, 2019-2027 (IN $ BILLION)
TABLE 6: NORTH AMERICA
DISPLAY MARKET, BY INDUSTRY VERTICAL, 2019-2027 (IN $ BILLION)
TABLE 7: NORTH AMERICA
DISPLAY MARKET, BY COUNTRY, 2019-2027 (IN $ BILLION)
FIGURE 1: NORTH AMERICA
DISPLAY MARKET, BY APPLICATION, 2018 & 2027 (IN %)
FIGURE 2: NORTH AMERICA
VEHICLE DISPLAY MARKET, 2019-2027 (IN $ BILLION)
FIGURE 3: NORTH AMERICA
FLAT-PANEL DISPLAY MARKET, 2019-2027 (IN $ BILLION)
FIGURE 4: NORTH AMERICA
CONSUMER ELECTRONICS MARKET, 2019-2027 (IN $ BILLION)
FIGURE 5: PORTER’S FIVE
FORCES ANALYSIS
FIGURE 6: MARKET ATTRACTIVENESS
INDEX
FIGURE 7: NORTH AMERICA
DISPLAY MARKET, BY FLAT-PANEL DISPLAY, 2019-2027 (IN $ BILLION)
FIGURE 8: NORTH AMERICA
DISPLAY MARKET, BY FLEXIBLE-PANEL DISPLAY, 2019-2027 (IN $ BILLION)
FIGURE 9: NORTH AMERICA
DISPLAY MARKET, BY TRANSPARENT- PANEL DISPLAY, 2019-2027 (IN $ BILLION)
FIGURE 10: NORTH
AMERICA DISPLAY MARKET, BY OLED, 2019-2027 (IN $ BILLION)
FIGURE 11: NORTH
AMERICA DISPLAY MARKET, BY QUANTUM DOT DISPLAY, 2019-2027 (IN $ BILLION)
FIGURE 12: NORTH
AMERICA DISPLAY MARKET, BY LED, 2019-2027 (IN $ BILLION)
FIGURE 13: NORTH
AMERICA DISPLAY MARKET, BY LCD, 2019-2027 (IN $ BILLION)
FIGURE 14: NORTH
AMERICA DISPLAY MARKET, BY E-PAPER, 2019-2027 (IN $ BILLION)
FIGURE 15: NORTH
AMERICA DISPLAY MARKET, BY OTHER TECHNOLOGIES, 2019-2027 (IN $ BILLION)
FIGURE 16: NORTH
AMERICA DISPLAY MARKET, BY SMARTPHONE & TABLET, 2019-2027 (IN $ BILLION)
FIGURE 17: NORTH
AMERICA DISPLAY MARKET, BY SMART WEARABLE, 2019-2027 (IN $ BILLION)
FIGURE 18: NORTH
AMERICA DISPLAY MARKET, BY TELEVISION & DIGITAL SIGNAGE, 2019-2027 (IN $
BILLION)
FIGURE 19: NORTH
AMERICA DISPLAY MARKET, BY PC & LAPTOP, 2019-2027 (IN $ BILLION)
FIGURE 20: NORTH
AMERICA DISPLAY MARKET, BY VEHICLE DISPLAY, 2019-2027 (IN $ BILLION)
FIGURE 21: NORTH
AMERICA DISPLAY MARKET, BY OTHER APPLICATIONS, 2019-2027 (IN $ BILLION)
FIGURE 22: NORTH
AMERICA DISPLAY MARKET, BY HEALTHCARE, 2019-2027 (IN $ BILLION)
FIGURE 23: NORTH
AMERICA DISPLAY MARKET, BY CONSUMER ELECTRONICS, 2019-2027 (IN $ BILLION)
FIGURE 24: NORTH
AMERICA DISPLAY MARKET, BY BFSI, 2019-2027 (IN $ BILLION)
FIGURE 25: NORTH
AMERICA DISPLAY MARKET, BY RETAIL, 2019-2027 (IN $ BILLION)
FIGURE 26: NORTH
AMERICA DISPLAY MARKET, BY MILITARY & DEFENSE, 2019-2027 (IN $ BILLION)
FIGURE 27: NORTH
AMERICA DISPLAY MARKET, BY AUTOMOTIVE, 2019-2027 (IN $ BILLION)
FIGURE 28: NORTH
AMERICA DISPLAY MARKET, BY OTHER INDUSTRIAL VERTICALS, 2019-2027 (IN $ BILLION)
FIGURE 29: NORTH
AMERICA DISPLAY MARKET, REGIONAL OUTLOOK, 2018 & 2027 (IN %)
FIGURE 30: UNITED
STATES DISPLAY MARKET, 2019-2027 (IN $ BILLION)
FIGURE 31: CANADA
DISPLAY MARKET, 2019-2027 (IN $ BILLION)