


Market By Drugs & Devices And Geography | Forecast 2019-2027
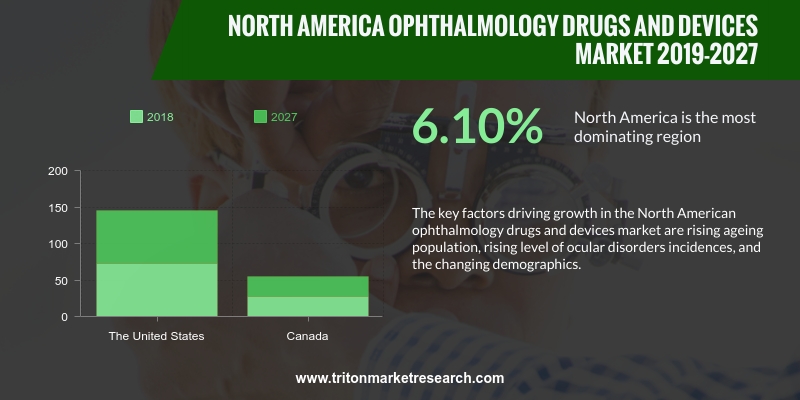
Triton Market Research has concluded that the North America ophthalmology drugs and devices market will grow at a CAGR of 6.10% in the estimated duration between 2019 and 2027.
The countries that have been scrutinized in North America’s market on ophthalmology drugs and devices are:
• The United States
• Canada
Report scope can be customized per your requirements. Request For Customization
The United States ophthalmology drugs and devices market is mainly driven by the rising number of studies on ophthalmological diseases and the government investments to support researches based on eye studies, coupled with the high prevalence of eye diseases. According to the Clinical Trial Organization, the United States stood first across North America for conducting ophthalmology-based studies and approximately 37 studies were reported in the country. These studies include, ‘Stem Cell Ophthalmology Treatment Study II’, which was conducted in the Healing Institute Margate, Florida, and the ‘Effect of Diabetes Education During Retinal Ophthalmology Visits On Diabetes Control’, that was conducted in California Retina Consultants, California. According to the National Eye Institute, in 2014, around 24 million people had cataracts which were expected to reach around 38.7 million by 2030, in the US. Hence, various ongoing studies on ophthalmology diseases and the rising prevalence of cataracts in the country are expected to boost the demand for ophthalmology drugs and devices that can positively influence the growth of the ophthalmology drugs and devices market in this region. Furthermore, government investment to support eye research also drives the market in the United States. As per the Research to Prevent Blindness Organization, in 2016, the organization awarded 36 grants totalling around $5.4 million. The latest awards include grants to the Department of Ophthalmology in 17 medical schools across the United States. This funding would help to support ophthalmology & eye research in the US and would raise the demand for ophthalmology drugs and devices, that positively influences the growth of the country’s ophthalmology drugs and devices market during the forecast period.
Johnson & Johnson, Inc., is a US-based multinational company that primarily operates in three domains - medical devices, pharmaceutical and consumer-packaged goods. The company has mainly in three segments such as consumer, pharmaceutical and medical devices. Company’s medical device segment comprises a wide range of products used in various fields such as orthopedic, surgery, cardiovascular, diabetes care and vision care fields. Blink Lid Wipes, Blink Tears Lubricating Eye Drops and Blink Tears Preservative-Free Lubricating Eye Drops are some of the products from the company’s range of eye care products. At the end of 2016, the company’s vision care generated revenues worth $2.7 billion.
Market By Type, Application, E ..
VIEW REPORT
Market By Device Type, Therape ..
VIEW REPORT
Market By Type, Application, T ..
VIEW REPORT
Market By Technology, Applicat ..
VIEW REPORT
Market By Application, Type, E ..
VIEW REPORT
Market by Therapeutics, Diagno ..
VIEW REPORT
Market by Type, Application, E ..
VIEW REPORT1.
NORTH AMERICA OPHTHALMOLOGY DRUGS AND DEVICES MARKET - SUMMARY
2.
INDUSTRY OUTLOOK
2.1. MARKET DEFINITION
2.2. PORTER’S FIVE FORCE ANALYSIS
2.2.1.
BARGAINING POWER OF BUYERS
2.2.2.
BARGAINING POWER OF SUPPLIER
2.2.3.
THREATS OF NEW ENTRANTS
2.2.4.
THREATS OF SUBSTITUTES
2.2.5.
COMPETITIVE RIVALRY
2.3. STRATEGIC OUTLOOK
2.4. KEY INSIGHT
2.5. VALUE CHAIN OUTLOOK
2.6. KEY BUYING STANDARDS
2.7. SUPPLY CHAIN OUTLOOK
2.8. REGULATORY FRAMEWORK
2.9. MARKET DRIVERS
2.9.1.
INCREASING OPHTHALMIC DISORDERS DUE TO HIGH BLOOD SUGAR
2.9.2.
UPSURGE IN HEALTHCARE SPENDING
2.9.3.
TECHNOLOGICAL ADVANCEMENT
2.10.
MARKET RESTRAINTS
2.10.1.
EXPIRATIONS OF BRAND PATENTS HAVE AFFECTED THE PHARMACEUTICAL INDUSTRY
2.10.2.
LOW COGNIZANCE RELATED TO OPHTHALMIC DRUGS
2.10.3.
DRUG APPROVALS DELAY AND NUMBER OF DRUGS IN THE PIPELINE
2.11.
MARKET OPPORTUNITIES
2.11.1.
DEMAND FOR PHACOEMULSIFICATION DEVICES AND INTRAOCULAR LENSES IS
INCREASING
2.12.
MARKET CHALLENGES
2.12.1.
DIFFICULTIES ASSOCIATED WITH THE CONDUCT OF OCULAR DISEASES
3.
OPHTHALMOLOGY DRUGS AND DEVICES MARKET OUTLOOK - BY DRUGS AND DEVICES
3.1. DEVICES
3.1.1.
DIAGNOSTIC & MONITORING EQUIPMENT
3.1.1.1.
OPTICAL COHERENCE TOMOGRAPHY
3.1.1.2.
OPHTHALMIC ULTRASOUND IMAGING SYSTEMS
3.1.1.3.
FUNDUS CAMERA MARKET
3.1.1.4.
OPHTHALMOSCOPES
3.1.1.5.
RETINOSCOPE
3.1.1.6.
PACHYMETER
3.1.1.7.
WAVEFRONT ABERROMETERS
3.1.1.8.
PERIMETERS/VISUAL FIELD ANALYZER
3.1.1.9.
AUTOREFRACTORS/PHOROPTER
3.1.1.10.
SPECULAR MICROSCOPE
3.1.1.11.
CORNEAL TOPOGRAPHERS
3.1.1.12.
OTHER DIAGNOSTIC & MONITORING EQUIPMENT MARKET
3.1.2.
SURGERY DEVICES
3.1.2.1.
CATARACT SURGERY DEVICES
3.1.2.2.
GLAUCOMA SURGERY DEVICES
3.1.2.3.
REFRACTIVE SURGERY DEVICES
3.1.2.4.
VITREORETINAL SURGERY DEVICES
3.1.3.
VISION CARE
3.2. DRUGS
3.2.1.
GLAUCOMA DRUG
3.2.2.
RETINAL DISORDER DRUG
3.2.3.
DRY EYE DRUG
3.2.4.
ALLERGIC CONJUNCTIVITIS, INFLAMMATION AND CONJUNCTIVITIS DRUG
3.2.5.
DRUGS BY USE OF PRESERVATION
3.2.5.1.
PRESERVED DRUGS
3.2.5.2.
PRESERVATIVE-FREE DRUGS
4.
OPHTHALMOLOGY DRUGS AND DEVICES MARKET - REGIONAL OUTLOOK
4.1. THE UNITED STATES
4.2. CANADA
5.
COMPETITIVE LANDSCAPE
5.1. ALLERGAN, INC.
5.2. BAYER
5.3. CARL ZEISS AG
5.4. ESSILOR INTERNATIONAL S.A.
5.5. GLAXOSMITHKLINE
5.6. JOHNSON & JOHNSON, INC.
5.7. NOVARTIS INTERNATIONAL AG
5.8. PFIZER
5.9. ROCHE HOLDING AG
5.10.
SANTEN PHARMACEUTICAL CO., LTD.
6.
METHODOLOGY AND SCOPE
6.1. RESEARCH SCOPE
6.2. SOURCES OF DATA
6.3. RESEARCH METHODOLOGY
TABLE 1 NORTH AMERICA OPHTHALMOLOGY
DRUGS AND DEVICES MARKET 2019-2027 ($ MILLION)
TABLE 2 COMMON CAUSES OF
LOSS OF VISION IN THE ELDERLY
TABLE 3 SELECTED LIST OF
GLAUCOMA DRUGS IN LATE-STAGE CLINICAL TRIALS
TABLE 4 NORTH AMERICA OPHTHALMOLOGY
DRUGS AND DEVICES MARKET BY DRUGS AND DEVICES 2019-2027 ($ MILLION)
TABLE 5 NORTH AMERICA
DEVICES MARKET IN DIAGNOSTIC & MONITORING EQUIPMENT BY TYPES 2019-2027 ($
MILLION)
TABLE 6 NORTH AMERICA
DEVICES MARKET IN SURGERY DEVICE BY TYPES 2019-2027 ($ MILLION)
TABLE 7 NORTH AMERICA DRUGS
AND DEVICES MARKET IN DRUGS BY TYPES 2019-2027 ($ MILLION)
TABLE 8 NORTH AMERICA OPHTHALMOLOGY
DRUGS AND DEVICES MARKET BY COUNTRIES 2019-2027 ($ MILLION)
FIGURE 1 NORTH AMERICA
OPHTHALMOLOGY DRUGS AND DEVICES MARKET 2019-2027 ($ MILLION)
FIGURE 2 NORTH AMERICA DRUGS
AND DEVICES MARKET IN DEVICES 2019-2027 ($ MILLION)
FIGURE 3 NORTH AMERICA DEVICES
MARKET IN DIAGNOSTIC & MONITORING EQUIPMENT 2019-2027 ($ MILLION)
FIGURE 4 NORTH AMERICA
DIAGNOSTIC & MONITORING EQUIPMENT MARKET IN OPTICAL COHERENCE TOMOGRAPHY
2019-2027 ($ MILLION)
FIGURE 5 NORTH AMERICA
DIAGNOSTIC & MONITORING EQUIPMENT MARKET IN OPHTHALMIC ULTRASOUND IMAGING
SYSTEMS 2019-2027 ($ MILLION)
FIGURE 6 NORTH AMERICA
DIAGNOSTIC & MONITORING EQUIPMENT MARKET IN FUNDUS CAMERA MARKET 2019-2027
($ MILLION)
FIGURE 7 NORTH AMERICA
DIAGNOSTIC & MONITORING EQUIPMENT MARKET IN OPHTHALMOSCOPES 2019-2027 ($
MILLION)
FIGURE 8 NORTH AMERICA
DIAGNOSTIC & MONITORING EQUIPMENT MARKET IN RETINOSCOPE 2019-2027 ($
MILLION)
FIGURE 9 NORTH AMERICA
DIAGNOSTIC & MONITORING EQUIPMENT MARKET IN PACHYMETER 2019-2027 ($
MILLION)
FIGURE 10 NORTH AMERICA DIAGNOSTIC
& MONITORING EQUIPMENT MARKET IN WAVEFRONT ABERROMETERS 2019-2027 ($
MILLION)
FIGURE 11 NORTH AMERICA
DIAGNOSTIC & MONITORING EQUIPMENT MARKET IN PERIMETERS/VISUAL FIELD
ANALYZER 2019-2027 ($ MILLION)
FIGURE 12 NORTH AMERICA
DIAGNOSTIC & MONITORING EQUIPMENT MARKET IN AUTOREFRACTORS/PHOROPTER
2019-2027 ($ MILLION)
FIGURE 13 NORTH AMERICA
DIAGNOSTIC & MONITORING EQUIPMENT MARKET IN SPECULAR MICROSCOPE 2019-2027
($ MILLION)
FIGURE 14 NORTH AMERICA
DIAGNOSTIC & MONITORING EQUIPMENT MARKET IN CORNEAL TOPOGRAPHERS 2019-2027
($ MILLION)
FIGURE 15 NORTH AMERICA
DIAGNOSTIC & MONITORING EQUIPMENT MARKET IN OTHER DIAGNOSTIC &
MONITORING EQUIPMENT MARKET 2019-2027 ($ MILLION)
FIGURE 16 NORTH AMERICA DEVICES
MARKET IN SURGERY DEVICE 2019-2027 ($ MILLION)
FIGURE 17 NORTH AMERICA SURGERY
DEVICES MARKET IN CATARACT SURGERY DEVICES 2019-2027 ($ MILLION)
FIGURE 18 NORTH AMERICA SURGERY
DEVICES MARKET IN GLAUCOMA SURGERY DEVICES 2019-2027 ($ MILLION)
FIGURE 19 NORTH AMERICA SURGERY
DEVICES MARKET IN REFRACTIVE SURGERY DEVICES 2019-2027 ($ MILLION)
FIGURE 20 NORTH AMERICA SURGERY
DEVICES MARKET IN VITREORETINAL SURGERY DEVICES 2019-2027 ($ MILLION)
FIGURE 21 NORTH AMERICA DEVICES
MARKET IN VISION CARE MARKET 2019-2027 ($ MILLION)
FIGURE 22 NORTH AMERICA DRUGS AND
DEVICES MARKET IN DRUGS 2019-2027 ($ MILLION)
FIGURE 23 NORTH AMERICA DRUGS
MARKET IN GLAUCOMA DRUG 2019-2027 ($ MILLION)
FIGURE 24 NORTH AMERICA DRUGS
MARKET IN RETINAL DISORDER DRUG 2019-2027 ($ MILLION)
FIGURE 25 NORTH AMERICA DRUGS
MARKET IN DRY EYE DRUG 2019-2027 ($ MILLION)
FIGURE 26 NORTH AMERICA DRUGS
MARKET IN ALLERGIC CONJUNCTIVITIS, INFLAMMATION AND CONJUNCTIVITIS DRUG
2019-2027 ($ MILLION)
FIGURE 27 NORTH AMERICA DRUGS BY
USE OF PRESERVATION IN PRESERVED DRUGS 2019-2027 ($ MILLION)
FIGURE 28 NORTH AMERICA DRUGS BY
USE OF PRESERVATION IN PRESERVATIVE-FREE DRUGS 2019-2027 ($ MILLION)
FIGURE 29 NORTH AMERICA
PRESERVATIVE-FREE DRUGS MARKET IN SINGLE-DOSE 2019-2027 ($ MILLION)
FIGURE 30 NORTH AMERICA
PRESERVATIVE-FREE DRUGS MARKET IN MULTI-DOSE 2019-2027 ($ MILLION)
FIGURE 31 THE UNITED STATES
OPHTHALMOLOGY DRUGS AND DEVICES MARKET 2019-2027 ($ MILLION)
FIGURE 32 CANADA
OPHTHALMOLOGY DRUGS AND DEVICES MARKET 2019-2027 ($ MILLION)