

Market By Product, Services And Geography | Forecast 2019-2027
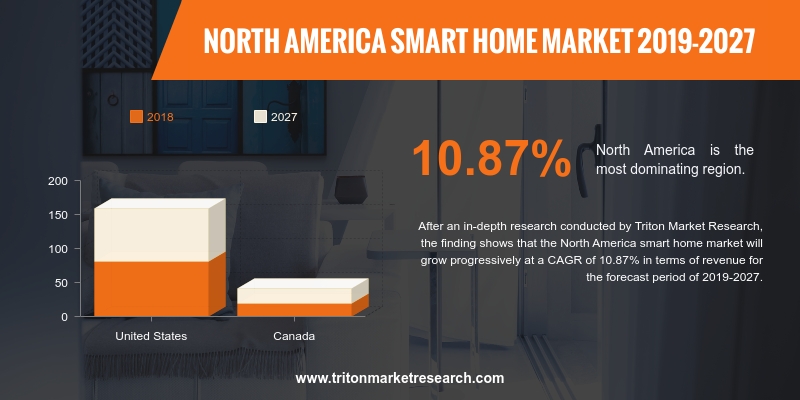
After in-depth research conducted by Triton Market Research, the finding shows that the North America smart home market will grow progressively at a CAGR of 10.87% in terms of revenue for the forecast period of 2019-2027.
The countries that have been studied in the smart home market in North America include:
• The United States
• Canada
The United States captured the majority of market share in the North America smart home market in 2018. On the other hand, Canada is predicted to be the fastest-growing country in the market in the coming years. The United States and Canada dominate the North American market region, wherein the US constitutes approximately XX% of the total smart home market in the region. The prominent players in the smart home market in North America are Honeywell, Crestron, Control 4 and AMX. The energy management market is the highest growing segment in North America due to energy management initiatives by the government such as the installation of smart meters and smart grids. Entertainment is the second-fastest-growing market in the country.

Report scope can be customized per your requirements. Request For Customization
The growth of the smart home market in the US can be largely attributed to factors such as consumer convenience, safety & security and the rising need for energy-efficient living. The increasing application of smart meters and smart electrical grids as a part of the government’s efficient energy management initiatives are the major drivers for the industry in the US market. The US government offers financial grants for energy-efficient construction. The use of appliances for entertainment constitutes a major part of the demand for smart homes from the consumer segment in the country. The major challenges faced by this market are the highly-priced appliances, low demand from consumers and a large number of electric devices needed for smart homes to function efficiently.
Blue Line Innovations, Inc. is a clean technology company that develops and markets energy monitoring devices. Its products include blue line optical sensor, power cost monitor, and power cost wi-fi bridges and sensors. Blue Line also offers data energy efficiency programs and non-AMI demand response. The company’s monitors are installed in an electricity meter that sends information to the LED display, smartphone, tablet and web-based applications. It offers portable, wireless, real-time energy reporting products for homes and small businesses. Blue Line is headquartered in Saint Johns, Newfoundland, Canada.
1. NORTH AMERICA SMART HOME MARKET - SUMMARY
2. INDUSTRY OUTLOOK
2.1. MARKET DEFINITION
2.2. KEY INSIGHTS
2.2.1. INCREASE IN THE ADOPTION OF ELECTRONIC GADGETS
2.2.2. CLOUD TECHNOLOGY HELPS IN THE GROWTH OF THE
MARKET
2.2.3. INCREASED ADOPTION OF SMART HOMES
2.3. EVOLUTION & TRANSITION OF SMART HOME
2.4. PORTER’S FIVE FORCE ANALYSIS
2.4.1. THREAT OF NEW ENTRANTS
2.4.2. THREAT OF SUBSTITUTE
2.4.3. BARGAINING POWER OF SUPPLIERS
2.4.4. BARGAINING POWER OF BUYERS
2.4.5. THREAT OF COMPETITIVE RIVALRY
2.5. KEY IMPACT ANALYSIS
2.5.1. COST
2.5.2. DATA SECURITY
2.5.3. COMFORT
2.6. MARKET ATTRACTIVENESS INDEX
2.7. VENDOR SCORECARD
2.8. INDUSTRY COMPONENTS
2.9. MARKET DRIVERS
2.9.1. GROWTH IN THE AGING POPULATION
2.9.2. GROWTH IN THE INTERNET OF THINGS (IOT)
DEVICES
2.9.3. INCREASE IN THE URBANIZATION AND
INFRASTRUCTURE PROJECTS
2.9.4. GOVERNMENTAL INITIATIVES
2.10. MARKET RESTRAINTS
2.10.1. COMPLEX INSTALLATION PROCEDURE OF SMART
DEVICES
2.10.2. PROBLEMS WITH DATA MANAGEMENT
2.10.3. HIGH PRICE OF SMART HOME PROJECTS
2.10.4. PRIVACY CONCERNS
2.11. MARKET OPPORTUNITIES
2.11.1. DEMAND FROM URBAN SECURITY
2.11.2. GROWTH OF SMART CITY PROJECTS
2.12. MARKET CHALLENGES
2.12.1. LOW AWARENESS ABOUT THE MARKET
2.12.2. LACK OF STANDARDIZATION AND PROBLEMS WITH
INTEROPERABILITY
3. NORTH AMERICA SMART HOME MARKET OUTLOOK - BY
PRODUCT
3.1. SECURITY
3.2. HVAC
3.3. LIGHTING CONTROLLERS
3.4. ENTERTAINMENT
3.5. ENERGY MANAGEMENT
3.6. HOME HEALTH
3.7. OTHERS
4. NORTH AMERICA SMART HOME MARKET OUTLOOK - BY
SERVICES
4.1. INSTALLATION AND REPAIR
4.2. CUSTOMIZATION
5. NORTH AMERICA SMART HOME MARKET - REGIONAL
OUTLOOK
5.1. UNITED STATES
5.2. CANADA
6. COMPETITIVE LANDSCAPE
6.1. ABB LTD.
6.2. BLUE LINE INNOVATIONS, INC.
6.3. CENTRICA CONNECTED HOME LIMITED
6.4. CENTURY TECHNOLOGIES CORP.
6.5. CONTROL4 CORPORATION
6.6. CRESTRON ELECTRONICS, INC.
6.7. EE LIMITED
6.8. EMERSON ELECTRIC, CO.
6.9. HONEYWELL INTERNATIONAL, INC.
6.10. JOHNSON CONTROLS, INC.
6.11. LG ELECTRONICS, INC.
6.12. SAMSUNG ELECTRONICS CO., LTD.
6.13. SCHNEIDER ELECTRIC SE
6.14. SIEMENS AG
6.15. SOLATUBE INTERNATIONAL, INC.
6.16. UNITED TECHNOLOGIES CORPORATION
6.17. VODAFONE GROUP PLC
7. RESEARCH METHODOLOGY & SCOPE
7.1. RESEARCH SCOPE & DELIVERABLES
7.2. SOURCES OF DATA
7.3. RESEARCH METHODOLOGY
TABLE 1: NORTH AMERICA SMART HOME MARKET, BY COUNTRY, 2019-2027 (IN $
MILLION)
TABLE 2: TECHNOLOGIES USED IN A HOME AREA NETWORK
TABLE 3: VENDOR SCORECARD
TABLE 4: KEY COUNTRIES BY CRIME INDEX
TABLE 5: NORTH AMERICA SMART HOME MARKET, BY PRODUCT, 2019-2027 (IN $
MILLION)
TABLE 6: NORTH AMERICA SMART HOME MARKET, BY SERVICES, 2019-2027 (IN $
MILLION)
TABLE 7: NORTH AMERICA SMART HOME MARKET, BY COUNTRY, 2019-2027 (IN $
MILLION)
FIGURE 1: EVOLUTION OF SMART HOME MARKET
FIGURE 2: PORTER’S FIVE FORCE ANALYSIS
FIGURE 3: KEY BUYING IMPACT ANALYSIS
FIGURE 4: MARKET ATTRACTIVENESS INDEX
FIGURE 5: INDUSTRY COMPONENTS
FIGURE 6: PERCENTAGE OF URBAN POPULATION ACROSS MAJOR REGIONS, 2017
FIGURE 7: NORTH AMERICA SMART HOME MARKET, BY SECURITY, 2019-2027 (IN $
MILLION)
FIGURE 8: NORTH AMERICA SMART HOME MARKET, BY HVAC, 2019-2027 (IN $
MILLION)
FIGURE 9: NORTH AMERICA SMART HOME MARKET, BY LIGHTING CONTROLLERS,
2019-2027 (IN $ MILLION)
FIGURE 10: NORTH AMERICA SMART HOME MARKET, BY ENTERTAINMENT, 2019-2027
(IN $ MILLION)
FIGURE 11: NORTH AMERICA SMART HOME MARKET, BY ENERGY MANAGEMENT,
2019-2027 (IN $ MILLION)
FIGURE 12: NORTH AMERICA SMART HOME MARKET, BY HOME HEALTH, 2019-2027
(IN $ MILLION)
FIGURE 13: NORTH AMERICA SMART HOME MARKET, BY OTHERS, 2019-2027 (IN $
MILLION)
FIGURE 14: NORTH AMERICA SMART HOME MARKET, BY INSTALLATION &
REPAIR, 2019-2027 (IN $ MILLION)
FIGURE 15: NORTH AMERICA SMART HOME MARKET, BY CUSTOMIZATION, 2019-2027
(IN $ MILLION)
FIGURE 16: NORTH AMERICA SMART HOME MARKET, REGIONAL OUTLOOK, 2018 &
2027 (IN %)
FIGURE 17: UNITED STATES SMART HOME MARKET, 2019-2027 (IN $ MILLION)
FIGURE 18: CANADA SMART HOME MARKET, 2019-2027 (IN $ MILLION)