


Market By Display Type, Technology, Application, Industry Vertical, And Geography | Forecast 2019-2027
As per Triton Market Research’s estimates, the European display market is set to display an upward trend in revenue, with a CAGR of 5.22% in the forecast period of 2019-2027.
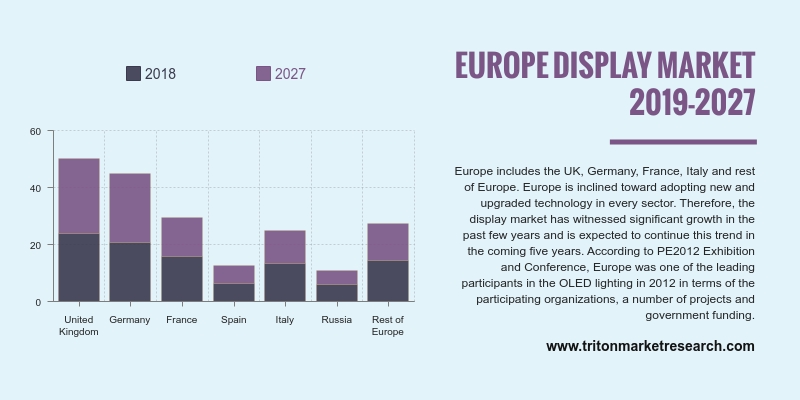
The countries scrutinized in the report on Europe’s display market are:
• The United Kingdom
• Germany
• France
• Italy
• Spain
• Russia
• Rest of Europe
Report scope can be customized per your requirements. Request For Customization
There is a high inclination in Europe towards the adoption of new and upgraded technology in every industrial sector. The display market has therefore grown significantly in recent years, and is expected to grow further in the coming years. The growth in various sectors, such as retail, electronics, automotive, and aerospace, is estimated to fuel growth in the display market in the region.
The automotive sector in the country is of prime importance, as Spain is the ninth-largest car manufacturer in the world, and the second-largest in Europe, succeeding Germany. 85% of the automotives produced in Spain are exported. With seventeen production plants in total, Spain is home to nine original equipment manufacturers (OEMs). The robust automotive sector in the country thus contributes to the growth of the Spanish display market.
Corning Incorporated manufactures and sells products in various segments, such as advanced optics, display glass, optical communications, life sciences, pharmaceutical technologies, and environmental technologies. With its expertise in optical physics, glass science, and ceramics science, the company offers several products that have found applications in the areas of telecommunications, drug discovery, LCD TVs, laptops, and computer monitors. Corning® EAGLE XG® Slim Glass substrates, Corning Lotus™ NXT Glass Corning Iris™ Glass are some of the products that are part of the company’s portfolio. Corning Incorporated has business presence in Europe, the Americas, & the Asia-Pacific, and the UAE & South Africa. In July 2017, the company signed a contract with Merck and Pfizer for developing the Corning Valor Glass.


Market by Technology (Data ana ..
VIEW REPORT1. EUROPE
DISPLAY MARKET – SUMMARY
2. INDUSTRY
OUTLOOK
2.1. MARKET
DEFINITION
2.2. KEY
INSIGHTS
2.2.1. VEHICLE
DISPLAY IS A RAPIDLY GROWING APPLICATION IN THE DISPLAY MARKET
2.2.2. FLAT-PANEL
DISPLAY IS THE LARGEST DISPLAY TYPE DURING THE FORECAST PERIOD
2.2.3. CONSUMER
ELECTRONICS IS THE LARGEST INDUSTRIAL VERTICAL USING DISPLAYS DURING THE
FORECAST PERIOD
2.3. PORTER’S
FIVE FORCES ANALYSIS
2.3.1. THREAT
OF NEW ENTRANTS
2.3.2. THREAT
OF SUBSTITUTE
2.3.3. BARGAINING
POWER OF SUPPLIERS
2.3.4. BARGAINING
POWER OF BUYERS
2.3.5. INTENSITY
OF COMPETITIVE RIVALRY
2.4. MARKET
ATTRACTIVENESS INDEX
2.5. VENDOR
SCORECARD
2.6. MARKET
DRIVERS
2.6.1. RISING
DEMAND FOR OLED DEVICES
2.6.2. INCREASING
DEMAND FOR TOUCH-BASED DEVICES
2.7. MARKET
RESTRAINTS
2.7.1. STAGNATION
IN THE GROWTH OF DESKTOP PC, NOTEBOOK, AND TABLET
2.7.2. INCREASING
COST OF CERTAIN DISPLAY TECHNOLOGIES
2.8. MARKET
OPPORTUNITIES
2.8.1. INCREASING
USE OF AR/VR DEVICES
2.9. MARKET
CHALLENGES
2.9.1. UNSTABLE
PRICING OF DISPLAY PANELS
3. DISPLAY
MARKET OUTLOOK – BY DISPLAY TYPE
3.1. FLAT-PANEL
DISPLAY
3.2. FLEXIBLE-PANEL
DISPLAY
3.3. TRANSPARENT-PANEL
DISPLAY
4. DISPLAY
MARKET OUTLOOK – BY TECHNOLOGY
4.1. OLED
4.2. QUANTUM
DOT
4.3. LED
4.4. LCD
4.5. E-PAPER
4.6. OTHER
TECHNOLOGIES
5. DISPLAY
MARKET OUTLOOK – BY APPLICATION
5.1. SMARTPHONE
& TABLET
5.2. SMART
WEARABLE
5.3. TELEVISION
& DIGITAL SIGNAGE
5.4. PC
& LAPTOP
5.5. VEHICLE
DISPLAY
5.6. OTHER
APPLICATIONS
6. DISPLAY
MARKET OUTLOOK – BY INDUSTRY VERTICAL
6.1. HEALTHCARE
6.2. CONSUMER
ELECTRONICS
6.3. BFSI
6.4. RETAIL
6.5. MILITARY
& DEFENSE
6.6. AUTOMOTIVE
6.7. OTHER
INDUSTRY VERTICALS
7. DISPLAY
MARKET – EUROPE
7.1. UNITED
KINGDOM
7.2. GERMANY
7.3. FRANCE
7.4. SPAIN
7.5. ITALY
7.6. RUSSIA
7.7. REST
OF EUROPE
8. COMPETITIVE
LANDSCAPE
8.1. AU
OPTRONICS CORP.
8.2. CORNING
INCORPORATED.
8.3. E
INK HOLDINGS INC.
8.4. HANNSTAR
DISPLAY CORPORATION DISPLAY CORPORATION
8.5. JAPAN
DISPLAY INC.
8.6. KENT
DISPLAYS, INC.
8.7. LG
DISPLAY
8.8. NEC
DISPLAY SOLUTIONS, LTD.
8.9. SAMSUNG
ELECTRONICS CO., LTD.
8.10.
SONY CORPORATION
9. RESEARCH
METHODOLOGY & SCOPE
9.1. RESEARCH
SCOPE & DELIVERABLES
9.1.1. OBJECTIVES
OF STUDY
9.1.2. SCOPE
OF STUDY
9.2. SOURCES
OF DATA
9.2.1. PRIMARY
DATA SOURCES
9.2.2. SECONDARY
DATA SOURCES
9.3. RESEARCH
METHODOLOGY
9.3.1. EVALUATION
OF PROPOSED MARKET
9.3.2. IDENTIFICATION
OF DATA SOURCES
9.3.3. ASSESSMENT
OF MARKET DETERMINANTS
9.3.4. DATA
COLLECTION
9.3.5. DATA
VALIDATION & ANALYSIS
TABLE 1: EUROPE DISPLAY
MARKET, BY COUNTRY, 2019-2027 (IN $ BILLION)
TABLE 2: VENDOR SCORECARD
TABLE 3: EUROPE DISPLAY
MARKET, BY DISPLAY TYPE, 2019-2027 (IN $ BILLION)
TABLE 4: EUROPE DISPLAY
MARKET, BY TECHNOLOGY, 2019-2027 (IN $ BILLION)
TABLE 5: EUROPE DISPLAY
MARKET, BY APPLICATION, 2019-2027 (IN $ BILLION)
TABLE 6: EUROPE DISPLAY
MARKET, BY INDUSTRY VERTICAL, 2019-2027 (IN $ BILLION)
TABLE 7: EUROPE DISPLAY
MARKET, BY COUNTRY, 2019-2027 (IN $ BILLION)
FIGURE 1: EUROPE
DISPLAY MARKET, BY APPLICATION, 2018 & 2027 (IN %)
FIGURE 2: EUROPE
VEHICLE DISPLAY MARKET, 2019-2027 (IN $ BILLION)
FIGURE 3: EUROPE
FLAT-PANEL DISPLAY MARKET, 2019-2027 (IN $ BILLION)
FIGURE 4: EUROPE
CONSUMER ELECTRONICS MARKET, 2019-2027 (IN $ BILLION)
FIGURE 5: PORTER’S FIVE
FORCES ANALYSIS
FIGURE 6: MARKET
ATTRACTIVENESS INDEX
FIGURE 7: EUROPE
DISPLAY MARKET, BY FLAT-PANEL DISPLAY, 2019-2027 (IN $ BILLION)
FIGURE 8: EUROPE
DISPLAY MARKET, BY FLEXIBLE-PANEL DISPLAY, 2019-2027 (IN $ BILLION)
FIGURE 9: EUROPE
DISPLAY MARKET, BY TRANSPARENT-PANEL DISPLAY, 2019-2027 (IN $ BILLION)
FIGURE 10: EUROPE
DISPLAY MARKET, BY OLED, 2019-2027 (IN $ BILLION)
FIGURE 11: EUROPE
DISPLAY MARKET, BY QUANTUM DOT DISPLAY, 2019-2027 (IN $ BILLION)
FIGURE 12: EUROPE
DISPLAY MARKET, BY LED, 2019-2027 (IN $ BILLION)
FIGURE 13: EUROPE
DISPLAY MARKET, BY LCD, 2019-2027 (IN $ BILLION)
FIGURE 14: EUROPE
DISPLAY MARKET, BY E-PAPER, 2019-2027 (IN $ BILLION)
FIGURE 15: EUROPE
DISPLAY MARKET, BY OTHER TECHNOLOGIES, 2019-2027 (IN $ BILLION)
FIGURE 16: EUROPE
DISPLAY MARKET, BY SMARTPHONE & TABLET, 2019-2027 (IN $ BILLION)
FIGURE 17: EUROPE
DISPLAY MARKET, BY SMART WEARABLE, 2019-2027 (IN $ BILLION)
FIGURE 18: EUROPE
DISPLAY MARKET, BY TELEVISION & DIGITAL SIGNAGE, 2019-2027 (IN $ BILLION)
FIGURE 19: EUROPE
DISPLAY MARKET, BY PC & LAPTOP, 2019-2027 (IN $ BILLION)
FIGURE 20: EUROPE
DISPLAY MARKET, BY VEHICLE DISPLAY, 2019-2027 (IN $ BILLION)
FIGURE 21: EUROPE
DISPLAY MARKET, BY OTHER APPLICATIONS, 2019-2027 (IN $ BILLION)
FIGURE 22: EUROPE
DISPLAY MARKET, BY HEALTHCARE, 2019-2027 (IN $ BILLION)
FIGURE 23: EUROPE DISPLAY
MARKET, BY CONSUMER ELECTRONICS, 2019-2027 (IN $ BILLION)
FIGURE 24: EUROPE
DISPLAY MARKET, BY BFSI, 2019-2027 (IN $ BILLION)
FIGURE 25: EUROPE
DISPLAY MARKET, BY RETAIL, 2019-2027 (IN $ BILLION)
FIGURE 26: EUROPE
DISPLAY MARKET, BY MILITARY & DEFENSE, 2019-2027 (IN $ BILLION)
FIGURE 27: EUROPE
DISPLAY MARKET, BY AUTOMOTIVE, 2019-2027 (IN $ BILLION)
FIGURE 28: EUROPE
DISPLAY MARKET, BY OTHER INDUSTRIAL VERTICALS, 2019-2027 (IN $ BILLION)
FIGURE 29: EUROPE
DISPLAY MARKET, REGIONAL OUTLOOK, 2018 & 2027 (IN %)
FIGURE 30: UNITED
KINGDOM DISPLAY MARKET, 2019-2027 (IN $ BILLION)
FIGURE 31: GERMANY
DISPLAY MARKET, 2019-2027 (IN $ BILLION)
FIGURE 32: FRANCE
DISPLAY MARKET, 2019-2027 (IN $ BILLION)
FIGURE 33: SPAIN
DISPLAY MARKET, 2019-2027 (IN $ BILLION)
FIGURE 34: ITALY
DISPLAY MARKET, 2019-2027 (IN $ BILLION)
FIGURE 35: RUSSIA
DISPLAY MARKET, 2019-2027 (IN $ BILLION)
FIGURE 36: REST OF
EUROPE DISPLAY MARKET, 2019-2027 (IN $ BILLION)