


Market By Display Type, Technology, Application, Industry Vertical, And Geography | Forecast 2019-2027
After a detailed analysis, Triton Market Research has concluded that the display market would display an upward trend and is estimated to grow at a CAGR of 5.12% in terms of revenue over the forecast period of 2019 to 2027. The market was assessed to be worth $XX million in the year 2018 and is predicted to generate a revenue of approximately $XX million by the year 2027.

Report scope can be customized per your requirements. Request For Customization
The display is a screen which helps in projecting information, particularly images, videos, and texts. Technologies such as liquid crystal display (LCD), light-emitting diodes (LED), organic light-emitting diode (OLED), and others are used in the display market. Display is the prime element of consumer electronic devices, such as TVs, laptops, tablets, smartphones, smartwatches, and others. Though flat-panel displays are trending in the consumer electronics sector, flexible-panel displays have also gained popularity. The market is continuously striving to produce energy-efficient devices, mainly the wearable devices.
Within this report from Triton on the display market, the market definition, and key insights regarding the industry have been discussed. Also, the market attractiveness matrix, vendor scorecard, key buying criteria, value chain analysis, and Porter’s five forces analysis have been studied for the display industry.
Market drivers like the rising demand for OLED devices and the increasing demand for touch-based devices are fueling the growth of the display market. On the flip side, market restraints like stagnation in the growth of desktop PCs, notebooks, & tablets and the increasing cost of certain display technologies are impeding the growth of the industry.
Key opportunities like the increasing use of AR/VR devices can be leveraged by the industry to get towards the projected growth. However, challenges such as unstable prices of display panels are being faced by the industry at this moment.
To get detailed insights on segments, Download Sample Report
Geographies covered for the global display market:
• North America: the United States and Canada
• Europe: the United Kingdom, Germany, France, Italy, Spain, Russia, and Rest of Europe
• Asia-Pacific: China, Japan, India, South Korea, ASEAN countries, Australia & New Zealand, and Rest of Asia-Pacific
• Latin America: Brazil, Mexico, and Rest of Latin America
• The Middle East and Africa: the United Arab Emirates, Turkey, Saudi Arabia, South Africa, and Rest of the Middle East and Africa
Segmentation analysis of the display market:
The display market has been segmented according to display type, technology, application, and industry vertical.
• Display Type is sub-segmented into:
O Flat-panel display
O Flexible-panel display
O Transparent-panel display
• Technology is sub-segmented into:
O OLED
O Quantum Dot
O LED
O LCD
O E-Paper
O Others
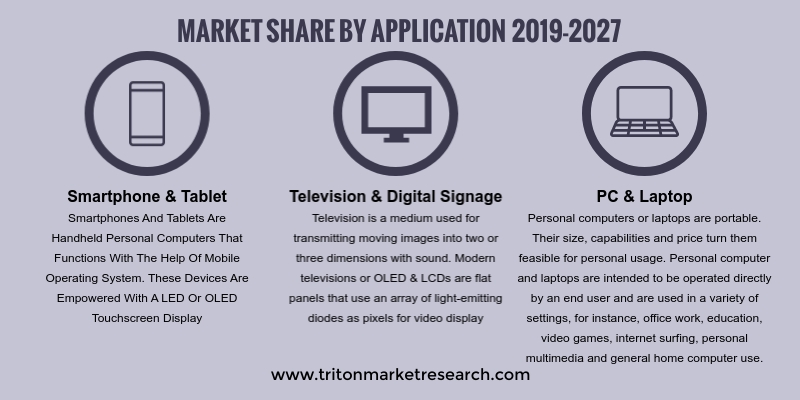
• Application is sub-segmented into:
O Smartphone & Tablet
O Smart wearable
O Television & Digital signage
O PC & laptop
O Vehicle display
O Others
• Industry verticals is sub-segmented into:
O Healthcare
O Consumer electronics
O BFSI
O Retail
O Military & Defense
O Automotive
O Others
Some of the prominent players in the display market are LG Display, Corning Incorporated, HannStar Display Corporation, NEC Display Solutions Ltd, E Ink Holdings Inc, Samsung Electronics Co. Ltd, AU Optronics Corp, Kent Displays Inc, Japan Display Inc, Sony Corporation.
The strategic analysis for each of these companies in the display market has been covered in detail. Company profiles help to dive into the information about the key market players in this industry and how much of a hold they have on the market. The immense growth opportunities are attracting new companies to rush into the market and thus accelerate the degree of competition.


Market by Technology (Data ana ..
VIEW REPORT1. GLOBAL
DISPLAY MARKET – SUMMARY
2. INDUSTRY
OUTLOOK
2.1. MARKET
DEFINITION
2.2. KEY
INSIGHTS
2.2.1. VEHICLE
DISPLAY IS A RAPIDLY GROWING APPLICATION IN THE DISPLAY MARKET
2.2.2. FLAT-PANEL
DISPLAY IS THE LARGEST DISPLAY TYPE DURING THE FORECAST PERIOD
2.2.3. CONSUMER
ELECTRONICS IS THE LARGEST INDUSTRIAL VERTICAL USING DISPLAYS DURING THE
FORECAST PERIOD
2.3. PORTER’S
FIVE FORCES ANALYSIS
2.3.1. THREAT
OF NEW ENTRANTS
2.3.2. THREAT
OF SUBSTITUTE
2.3.3. BARGAINING
POWER OF SUPPLIERS
2.3.4. BARGAINING
POWER OF BUYERS
2.3.5. INTENSITY
OF COMPETITIVE RIVALRY
2.4. MARKET
ATTRACTIVENESS INDEX
2.5. VENDOR
SCORECARD
2.6. MARKET
DRIVERS
2.6.1. RISING
DEMAND FOR OLED DEVICES
2.6.2. INCREASING
DEMAND OF TOUCH-BASED DEVICES
2.7. MARKET
RESTRAINTS
2.7.1. STAGNATION
IN THE GROWTH OF DESKTOP PC, NOTEBOOK, AND TABLET
2.7.2. INCREASING
COST OF CERTAIN DISPLAY TECHNOLOGIES
2.8. MARKET
OPPORTUNITIES
2.8.1. INCREASING
USE OF AR/VR DEVICES
2.9. MARKET
CHALLENGES
2.9.1. UNSTABLE
PRICING OF DISPLAY PANELS
3. DISPLAY
MARKET OUTLOOK – BY DISPLAY TYPE
3.1. FLAT-PANEL
DISPLAY
3.2. FLEXIBLE-PANEL
DISPLAY
3.3. TRANSPARENT-PANEL
DISPLAY
4. DISPLAY
MARKET OUTLOOK – BY TECHNOLOGY
4.1. OLED
4.2. QUANTUM
DOT
4.3. LED
4.4. LCD
4.5. E-PAPER
4.6. OTHER
TECHNOLOGIES
5. DISPLAY
MARKET OUTLOOK – BY APPLICATION
5.1. SMARTPHONE
& TABLET
5.2. SMART
WEARABLE
5.3. TELEVISION
& DIGITAL SIGNAGE
5.4. PC
& LAPTOP
5.5. VEHICLE
DISPLAY
5.6. OTHER
APPLICATIONS
6. DISPLAY
MARKET OUTLOOK – BY INDUSTRY VERTICAL
6.1. HEALTHCARE
6.2. CONSUMER
ELECTRONICS
6.3. BFSI
6.4. RETAIL
6.5. MILITARY
& DEFENSE
6.6. AUTOMOTIVE
6.7. OTHER
INDUSTRY VERTICALS
7. DISPLAY
MARKET – REGIONAL OUTLOOK
7.1. NORTH
AMERICA
7.1.1. MARKET
BY DISPLAY TYPE
7.1.2. MARKET
BY TECHNOLOGY
7.1.3. MARKET
BY APPLICATION
7.1.4. MARKET
BY INDUSTRIAL VERTICAL
7.1.5. COUNTRY
ANALYSIS
7.1.5.1. THE
UNITED STATES
7.1.5.2. CANADA
7.2. EUROPE
7.2.1. MARKET
BY DISPLAY TYPE
7.2.2. MARKET
BY TECHNOLOGY
7.2.3. MARKET
BY APPLICATION
7.2.4. MARKET
BY INDUSTRIAL VERTICAL
7.2.5. COUNTRY
ANALYSIS
7.2.5.1. THE
UNITED KINGDOM
7.2.5.2. GERMANY
7.2.5.3. FRANCE
7.2.5.4. SPAIN
7.2.5.5. ITALY
7.2.5.6. RUSSIA
7.2.5.7. REST
OF EUROPE
7.3. ASIA-PACIFIC
7.3.1. MARKET
BY DISPLAY TYPE
7.3.2. MARKET
BY TECHNOLOGY
7.3.3. MARKET
BY APPLICATION
7.3.4. MARKET
BY INDUSTRIAL VERTICAL
7.3.5. COUNTRY
ANALYSIS
7.3.5.1. CHINA
7.3.5.2. JAPAN
7.3.5.3. INDIA
7.3.5.4. SOUTH
KOREA
7.3.5.5. ASEAN
COUNTRIES
7.3.5.6. AUSTRALIA
& NEW ZEALAND
7.3.5.7. REST
OF ASIA-PACIFIC
7.4. LATIN
AMERICA
7.4.1. MARKET
BY DISPLAY TYPE
7.4.2. MARKET
BY TECHNOLOGY
7.4.3. MARKET
BY APPLICATION
7.4.4. MARKET
BY INDUSTRIAL VERTICAL
7.4.5. COUNTRY
ANALYSIS
7.4.5.1. BRAZIL
7.4.5.2. MEXICO
7.4.5.3. REST
OF LATIN AMERICA
7.5. MIDDLE
EAST AND AFRICA
7.5.1. MARKET
BY DISPLAY TYPE
7.5.2. MARKET
BY TECHNOLOGY
7.5.3. MARKET
BY APPLICATION
7.5.4. MARKET
BY INDUSTRIAL VERTICAL
7.5.5. COUNTRY
ANALYSIS
7.5.5.1. THE
UNITED ARAB EMIRATES
7.5.5.2. TURKEY
7.5.5.3. SAUDI
ARABIA
7.5.5.4. SOUTH
AFRICA
7.5.5.5. REST
OF MIDDLE EAST & AFRICA
8. COMPETITIVE
LANDSCAPE
8.1. AU
OPTRONICS CORP.
8.2. CORNING
INCORPORATED.
8.3. E
INK HOLDINGS INC.
8.4. HANNSTAR
DISPLAY CORPORATION
8.5. JAPAN
DISPLAY INC.
8.6. KENT
DISPLAYS, INC.
8.7. LG
DISPLAY
8.8. NEC
DISPLAY SOLUTIONS, LTD.
8.9. SAMSUNG
ELECTRONICS CO., LTD.
8.10. SONY CORPORATION
9. RESEARCH
METHODOLOGY & SCOPE
9.1. RESEARCH
SCOPE & DELIVERABLES
9.1.1. OBJECTIVES
OF STUDY
9.1.2. SCOPE
OF STUDY
9.2. SOURCES
OF DATA
9.2.1. PRIMARY
DATA SOURCES
9.2.2. SECONDARY
DATA SOURCES
9.3. RESEARCH
METHODOLOGY
9.3.1. EVALUATION
OF PROPOSED MARKET
9.3.2. IDENTIFICATION
OF DATA SOURCES
9.3.3. ASSESSMENT
OF MARKET DETERMINANTS
9.3.4. DATA
COLLECTION
9.3.5. DATA
VALIDATION & ANALYSIS
TABLE 1: GLOBAL DISPLAY
MARKET, BY GEOGRAPHY, 2019-2027 (IN $ BILLION)
TABLE 2: VENDOR
SCORECARD
TABLE 3: GLOBAL DISPLAY
MARKET, BY DISPLAY TYPE, 2019-2027 (IN $ BILLION)
TABLE 4: GLOBAL DISPLAY
MARKET, BY TECHNOLOGY, 2019-2027 (IN $ BILLION)
TABLE 5: GLOBAL DISPLAY
MARKET, BY APPLICATION, 2019-2027 (IN $ BILLION)
TABLE 6: GLOBAL DISPLAY
MARKET, BY INDUSTRY VERTICAL, 2019-2027 (IN $ BILLION)
TABLE 7: GLOBAL DISPLAY
MARKET, BY GEOGRAPHY, 2019-2027 (IN $ BILLION)
TABLE 8: NORTH AMERICA
DISPLAY MARKET, BY COUNTRY, 2019-2027 (IN $ BILLION)
TABLE 9: NORTH AMERICA
DISPLAY MARKET, BY DISPLAY TYPE, 2019-2027 (IN $ BILLION)
TABLE 10: NORTH AMERICA
DISPLAY MARKET, BY TECHNOLOGY, 2019-2027 (IN $ BILLION)
TABLE 11: NORTH AMERICA
DISPLAY MARKET, BY APPLICATION, 2019-2027 (IN $ BILLION)
TABLE 12: NORTH AMERICA
DISPLAY MARKET, BY INDUSTRIAL VERTICAL, 2019-2027 (IN $ BILLION)
TABLE 13: EUROPE
DISPLAY MARKET, BY COUNTRY, 2019-2027 (IN $ BILLION)
TABLE 14: EUROPE
DISPLAY MARKET, BY DISPLAY TYPE, 2019-2027 (IN $ BILLION)
TABLE 15: EUROPE
DISPLAY MARKET, BY TECHNOLOGY, 2019-2027 (IN $ BILLION)
TABLE 16: EUROPE
DISPLAY MARKET, BY APPLICATION, 2019-2027 (IN $ BILLION)
TABLE 17: EUROPE
DISPLAY MARKET, BY INDUSTRIAL VERTICAL, 2019-2027 (IN $ BILLION)
TABLE 18: ASIA-PACIFIC
DISPLAY MARKET, BY COUNTRY, 2019-2027 (IN $ BILLION)
TABLE 19: ASIA-PACIFIC
DISPLAY MARKET, BY DISPLAY TYPE, 2019-2027 (IN $ BILLION)
TABLE 20: ASIA-PACIFIC
DISPLAY MARKET, BY TECHNOLOGY, 2019-2027 (IN $ BILLION)
TABLE 21: ASIA-PACIFIC
DISPLAY MARKET, BY APPLICATION, 2019-2027 (IN $ BILLION)
TABLE 22: ASIA-PACIFIC
DISPLAY MARKET, BY INDUSTRIAL VERTICAL, 2019-2027 (IN $ BILLION)
TABLE 23: LATIN AMERICA
DISPLAY MARKET, BY COUNTRY, 2019-2027 (IN $ BILLION)
TABLE 24: LATIN AMERICA
DISPLAY MARKET, BY DISPLAY TYPE, 2019-2027 (IN $ BILLION)
TABLE 25: LATIN AMERICA
DISPLAY MARKET, BY TECHNOLOGY, 2019-2027 (IN $ BILLION)
TABLE 26: LATIN AMERICA
DISPLAY MARKET, BY APPLICATION, 2019-2027 (IN $ BILLION)
TABLE 27: LATIN AMERICA
DISPLAY MARKET, BY INDUSTRIAL VERTICAL, 2019-2027 (IN $ BILLION)
TABLE 28: MIDDLE EAST
AND AFRICA DISPLAY MARKET, by COUNTRY, 2019-2027 (IN $ BILLION)
TABLE 29: MIDDLE EAST
AND AFRICA DISPLAY MARKET, BY DISPLAY TYPE, 2019-2027 (IN $ BILLION)
TABLE 30: MIDDLE EAST
AND AFRICA DISPLAY MARKET, BY TECHNOLOGY, 2019-2027 (IN $ BILLION)
TABLE 31: MIDDLE EAST
AND AFRICA DISPLAY MARKET, BY APPLICATION, 2019-2027 (IN $ BILLION)
TABLE 32: MIDDLE EAST
AND AFRICA DISPLAY MARKET, BY INDUSTRIAL VERTICAL, 2019-2027 (IN $ BILLION)
FIGURE 1: GLOBAL
DISPLAY MARKET, BY APPLICATION, 2018 & 2027 (IN %)
FIGURE 2: GLOBAL
VEHICLE DISPLAY MARKET, 2019-2027 (IN $ BILLION)
FIGURE 3: GLOBAL
FLAT-PANEL DISPLAY MARKET, 2019-2027 (IN $ BILLION)
FIGURE 4: GLOBAL CONSUMER
ELECTRONICS MARKET, 2019-2027 (IN $ BILLION)
FIGURE 5: PORTER’S FIVE
FORCES ANALYSIS
FIGURE 6: MARKET
ATTRACTIVENESS INDEX
FIGURE 7: GLOBAL
DISPLAY MARKET, BY FLAT-PANEL DISPLAY, 2019-2027 (IN $ BILLION)
FIGURE 8: GLOBAL
DISPLAY MARKET, BY FLEXIBLE-PANEL DISPLAY, 2019-2027 (IN $ BILLION)
FIGURE 9: GLOBAL
DISPLAY MARKET, BY TRANSPARENT-PANEL DISPLAY, 2019-2027 (IN $ BILLION)
FIGURE 10: GLOBAL
DISPLAY MARKET, BY OLED, 2019-2027 (IN $ BILLION)
FIGURE 11: GLOBAL
DISPLAY MARKET, BY QUANTUM DOT DISPLAY, 2019-2027 (IN $ BILLION)
FIGURE 12: GLOBAL
DISPLAY MARKET, BY LED, 2019-2027 (IN $ BILLION)
FIGURE 13: GLOBAL
DISPLAY MARKET, BY LCD, 2019-2027 (IN $ BILLION)
FIGURE 14: GLOBAL
DISPLAY MARKET, BY E-PAPER, 2019-2027 (IN $ BILLION)
FIGURE 15: GLOBAL
DISPLAY MARKET, BY OTHER TECHNOLOGIES, 2019-2027 (IN $ BILLION)
FIGURE 16: GLOBAL
DISPLAY MARKET, BY SMARTPHONE & TABLET, 2019-2027 (IN $ BILLION)
FIGURE 17: GLOBAL
DISPLAY MARKET, BY SMART WEARABLE, 2019-2027 (IN $ BILLION)
FIGURE 18: GLOBAL
DISPLAY MARKET, BY TELEVISION & DIGITAL SIGNAGE, 2019-2027 (IN $ BILLION)
FIGURE 19: GLOBAL
DISPLAY MARKET, BY PC & LAPTOP, 2019-2027 (IN $ BILLION)
FIGURE 20: GLOBAL
DISPLAY MARKET, BY VEHICLE DISPLAY, 2019-2027 (IN $ BILLION)
FIGURE 21: GLOBAL
DISPLAY MARKET, BY OTHER APPLICATIONS, 2019-2027 (IN $ BILLION)
FIGURE 22: GLOBAL
DISPLAY MARKET, BY HEALTHCARE, 2019-2027 (IN $ BILLION)
FIGURE 23: GLOBAL
DISPLAY MARKET, BY CONSUMER ELECTRONICS, 2019-2027 (IN $ BILLION)
FIGURE 24: GLOBAL
DISPLAY MARKET, BY BFSI, 2019-2027 (IN $ BILLION)
FIGURE 25: GLOBAL
DISPLAY MARKET, BY RETAIL, 2019-2027 (IN $ BILLION)
FIGURE 26: GLOBAL
DISPLAY MARKET, BY MILITARY & DEFENSE, 2019-2027 (IN $ BILLION)
FIGURE 27: GLOBAL
DISPLAY MARKET, BY AUTOMOTIVE, 2019-2027 (IN $ BILLION)
FIGURE 28: GLOBAL
DISPLAY MARKET, BY OTHER INDUSTRIAL VERTICALS, 2019-2027 (IN $ BILLION)
FIGURE 29: GLOBAL
DISPLAY MARKET, REGIONAL OUTLOOK, 2018 & 2027 (IN %)
FIGURE 30: THE UNITED
STATES DISPLAY MARKET, 2019-2027 (IN $ BILLION)
FIGURE 31: CANADA DISPLAY
MARKET, 2019-2027 (IN $ BILLION)
FIGURE 32: THE UNITED
KINGDOM DISPLAY MARKET, 2019-2027 (IN $ BILLION)
FIGURE 33: GERMANY
DISPLAY MARKET, 2019-2027 (IN $ BILLION)
FIGURE 34: FRANCE
DISPLAY MARKET, 2019-2027 (IN $ BILLION)
FIGURE 35: SPAIN DISPLAY
MARKET, 2019-2027 (IN $ BILLION)
FIGURE 36: ITALY
DISPLAY MARKET, 2019-2027 (IN $ BILLION)
FIGURE 37: RUSSIA
DISPLAY MARKET, 2019-2027 (IN $ BILLION)
FIGURE 38: REST OF
EUROPE DISPLAY MARKET, 2019-2027 (IN $ BILLION)
FIGURE 39: CHINA
DISPLAY MARKET, 2019-2027 (IN $ BILLION)
FIGURE 40: JAPAN
DISPLAY MA RKET, 2019-2027 (IN $ BILLION)
FIGURE 41: INDIA
DISPLAY MARKET, 2019-2027 (IN $ BILLION)
FIGURE 42: SOUTH KOREA
DISPLAY MARKET, 2019-2027 (IN $ BILLION)
FIGURE 43: ASEAN
COUNTRIES DISPLAY MARKET, 2019-2027 (IN $ BILLION)
FIGURE 44: AUSTRALIA
& NEW ZEALAND DISPLAY MARKET, 2019-2027 (IN $ BILLION)
FIGURE 45: REST OF
ASIA-PACIFIC DISPLAY MARKET, 2019-2027 (IN $ BILLION)
FIGURE 46: BRAZIL
DISPLAY MARKET, 2019-2027 (IN $ BILLION)
FIGURE 47: MEXICO DISPLAY
MARKET, 2019-2027 (IN $ BILLION)
FIGURE 48: REST OF
LATIN AMERICA DISPLAY MARKET, 2019-2027 (IN $ BILLION)
FIGURE 49: THE UNITED
ARAB EMIRATES DISPLAY MARKET, 2019-2027 (IN $ BILLION)
FIGURE 50: TURKEY
DISPLAY MARKET, 2019-2027 (IN $ BILLION)
FIGURE 51: SAUDI ARABIA
DISPLAY MARKET, 2019-2027 (IN $ BILLION)
FIGURE 52: SOUTH AFRICA
DISPLAY MARKET, 2019-2027 (IN $ BILLION)
FIGURE 53: REST OF
MIDDLE EAST & AFRICA DISPLAY MARKET, 2019-2027 (IN $ BILLION)