

Market By Type, Application, And Geography | Forecast 2019-2027
According to Triton, the research on the Europe process oil market is estimated to record a significant growth at a CAGR of 3.61% in terms of revenue and 3.25% in terms of volume over the period 2019-2027.
Countries that are studied in Europe’s process oil market are:
• Russia
• Italy
• Germany
• United Kingdom
• France
• Spain
• Rest of Europe

Report scope can be customized per your requirements. Request For Customization
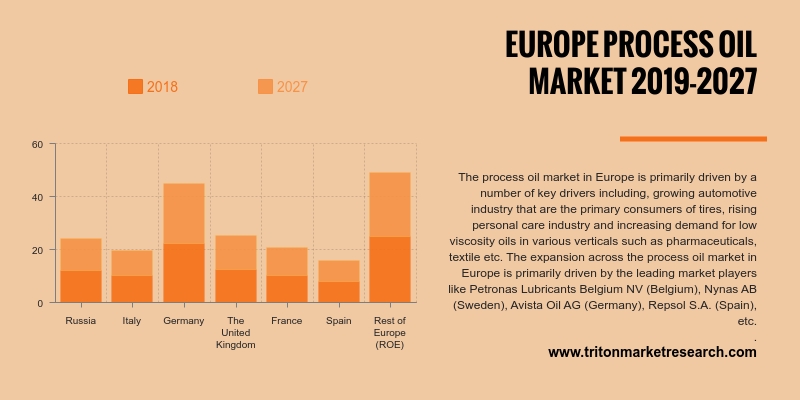
The growing automotive industry, the rising personal care industry, and the increasing demand for low viscosity oils mainly drive the process oil market in Europe. There is an increasing demand for rubber process oil due to the requirement for rubber tires in growing motor vehicle consumption. Rubber process oil is used in the production of tires to enhance the rubber compound’s flow characteristics while improving the filler’s dispersion process.
Germany holds the largest market share in the European process oil market. The country dominates the automobile sector. In 2017, Germany sold around 3.8 million motor vehicles, which is further expected to grow the demand for process oils. Moreover, significant investments made for capacity expansion in the rubber & plastic industry in the country are also predicted to fuel the growth of the German process oil market.
Due to the rising consumer awareness of chemicals in cosmetics and toiletries, the demand for organic cosmetics has been increasing in the French market. France is the second-largest country for beauty and personal care products. Many multinational companies are launching innovative products to attract consumers. In the textile industry, process oil is used to minimize friction in the weaving process and improve efficiency. It works as a cleaning agent in the manufacturing process, and thus, growth in the textile industry is expected to drive the process oil market in Europe.
Nynas AB is a Swedish company that sells specialty oils products in the Nordic countries, the Rest of Europe, the Americas, and across the world through its subsidiaries. The company offers naphthenic specialty oils, such as transformer oils for insulation and cooling of power and distribution transformers, base oils for use as a component in cutting fluids for the metalworking and in greases and other industrial lubricants.
1. EUROPE
PROCESS OIL MARKET – SUMMARY
2. INDUSTRY
OUTLOOK
2.1. MARKET
DEFINITION
2.2. PORTER’S
FIVE FORCES MODEL
2.2.1. BARGAINING
POWER OF BUYERS
2.2.2. BARGAINING
POWER OF SUPPLIERS
2.2.3. THREAT
OF NEW ENTRANTS
2.2.4. THREAT
OF SUBSTITUTES
2.2.5. THREAT
OF RIVALRY
2.3. REGULATORY
OUTLOOK
2.4. MARKET
TRENDS
2.5. MARKET
SHARE OUTLOOK
2.6. MARKET
ATTRACTIVENESS INDEX
2.7. KEY
INSIGHT
2.8. MARKET
DRIVERS
2.8.1. INCREASING
DEMAND FOR PROCESS OIL IN THE TEXTILE INDUSTRY
2.8.2. GROWING
PERSONAL CARE INDUSTRY
2.8.3. RISING
VEHICULAR PRODUCTION AND GROWING AUTOMOTIVE SECTOR
2.9. MARKET
RESTRAINTS
2.9.1. RESTRICTIONS
IN THE USAGE OF POLYCYCLIC AROMATIC HYDROCARBON (PAH)
2.9.2. EMERGENCE
OF DRY-TYPE TRANSFORMERS
2.10.
MARKET OPPORTUNITIES
2.10.1.
OPPORTUNITIES PRESENTED BY ADHERING TO THE
USAGE OF LOW POLYAROMATIC HYDROCARBON (PAH) OILS
2.10.2.
MOUNTING EXPLORATION ACTIVITY OF HYDROCARBONS
IN NON-OPEC REGIONS
2.11.
MARKET CHALLENGES
2.11.1.
FLUCTUATING RAW MATERIAL PRICES
2.11.2.
CHANGING CRUDE OIL PRICES
3. PROCESS
OIL MARKET OUTLOOK – BY TYPE
3.1. NAPHTHENIC
OIL
3.2. PARAFFIN
3.3. AROMATIC
3.4. NON-CARCINOGENIC
4. PROCESS
OIL MARKET OUTLOOK – BY APPLICATION
4.1. TIRE
& RUBBER
4.2. POLYMER
4.3. PERSONAL
CARE
4.4. TEXTILE
4.5. OTHER
APPLICATIONS
5. PROCESS
OIL MARKET – REGIONAL OUTLOOK
5.1. EUROPE
5.1.1. COUNTRY
ANALYSIS
5.1.1.1. THE
UNITED KINGDOM
5.1.1.2. ITALY
5.1.1.3. GERMANY
5.1.1.4. FRANCE
5.1.1.5. SPAIN
5.1.1.6. RUSSIA
5.1.1.7. REST
OF EUROPE
6. COMPANY
PROFILES
6.1. CHEVRON
CORPORATION
6.2. GAZPROM
6.3. GP
PETROLEUMS
6.4. APAR
INDUSTRIES LTD.
6.5. LANXESS
PROCESS OIL
6.6. ROYAL
DUTCH SHELL PLC
6.7. HINDUSTAN
PETROLEUM CORPORATION LTD.
6.8. HOLLYFRONTIER
REFINING & MARKETING INC.
6.9. CALUMET
SPECIALTY PRODUCTS PARTNERS, L.P.
6.10.
ERGON NORTH & SOUTH AMERICA
6.11.
TOTAL SA
6.12.
PETROCHINA COMPANY LTD.
6.13.
IDEMITSU KOSAN CO., LTD.
6.14.
EXXON MOBIL CHEMICAL COMPANY
6.15.
PETROBRAS
6.16.
REPSOL S.A.
6.17.
SASOL
6.18.
IRANOL COMPANY
6.19.
JX NIPPON OIL & GAS EXPLORATION
6.20.
NYNAS AB
6.21.
SUNOCO LP
6.22.
LUKOIL
6.23.
ORGKHIM BIOCHEMICAL HOLDING
6.24.
PANAMA PETROCHEM LTD.
6.25.
PETRONAS LUBRICANTS INTERNATIONAL
6.26.
ROSNEFT
7. RESEARCH
METHODOLOGY & SCOPE
7.1. RESEARCH
SCOPE & DELIVERABLES
7.1.1. OBJECTIVES
OF STUDY
7.1.2. SCOPE
OF STUDY
7.2. SOURCES
OF DATA
7.2.1. PRIMARY
DATA SOURCES
7.2.2. SECONDARY
DATA SOURCES
7.3. RESEARCH
METHODOLOGY
7.3.1. EVALUATION
OF PROPOSED MARKET
7.3.2. IDENTIFICATION
OF DATA SOURCES
7.3.3. ASSESSMENT
OF MARKET DETERMINANTS
7.3.4. DATA
COLLECTION
7.3.5. DATA
VALIDATION & ANALYSIS
TABLE 1 EUROPE PROCESS OIL MARKET, 2019-2027 ($ MILLION)
TABLE 2 EUROPE PROCESS OIL MARKET, 2019-2027 (KILOTONS)
TABLE 3 TYPE OF PROCESS OIL
TABLE 4 GROUPING AS PER REFINING PROCESS
TABLE 5 PROPERTIES OF LIGHT NEUTRAL BASE OILS
TABLE 6 CHARACTERISTICS OF TEMPERATURE ON VISCOSITY
TABLE 7 CARCINOGENIC CLASSIFICATIONS OF PAH COMPOUNDS BY SPECIFIC
AGENCIES
TABLE 8 EUROPE PROCESS OIL MARKET, BY TYPE, 2019-2027 ($ MILLION)
TABLE 9 COMPARISON OF DIFFERENT TYPES OF RUBBER PROCESS OIL
TABLE 10 EUROPE PROCESS OIL MARKET, BY TYPE,
2019-2027 (KILOTONS)
TABLE 11 EUROPE PROCESS OIL MARKET, BY APPLICATION,
2019-2027 ($ MILLION)
TABLE 12 PROCESS OIL PRODUCTS USED IN TEXTILE
INDUSTRIES
TABLE 13 PRODUCT TYPE FOR HOT MELT ADHESIVE
MANUFACTURING INDUSTRY
TABLE 14 EUROPE PROCESS OIL MARKET, BY COUNTRY,
2019-2027 ($ MILLION)
TABLE 15 EUROPE PROCESS OIL MARKET, BY COUNTRY,
2019-2027 (KILOTONS)
FIGURE 1 EUROPE PROCESS OIL MARKET, 2019-2027 ($
MILLION)
FIGURE 2 EUROPE PROCESS OIL MARKET, 2019-2027
(KILOTONS)
FIGURE 3 PROCESS OIL COMPANY MARKET SHARE OUTLOOK
2018 (%)
FIGURE 4 EUROPE PROCESS OIL MARKET, BY NAPHTHENIC
OIL, 2019-2027 ($ MILLION)
FIGURE 5 EUROPE PROCESS OIL MARKET, BY NAPHTHENIC
OIL, 2019-2027 (KILOTONS)
FIGURE 6 EUROPE PROCESS OIL MARKET, BY PARAFFIN,
2019-2027 ($ MILLION)
FIGURE 7 EUROPE PROCESS OIL MARKET, BY PARAFFIN,
2019-2027 (KILOTONS)
FIGURE 8 EUROPE PROCESS OIL MARKET, BY AROMATIC,
2019-2027 ($ MILLION)
FIGURE 9 EUROPE PROCESS OIL MARKET, BY AROMATIC,
2019-2027 (KILOTONS)
FIGURE 10 EUROPE PROCESS OIL MARKET, BY
NON-CARCINOGENIC, 2019-2027 ($ MILLION)
FIGURE 11 EUROPE PROCESS OIL MARKET, BY
NON-CARCINOGENIC, 2019-2027 (KILOTONS)
FIGURE 12 EUROPE PROCESS OIL MARKET, BY TIRE &
RUBBER, 2019-2027 ($ MILLION)
FIGURE 13 EUROPE PROCESS OIL MARKET, BY POLYMER,
2019-2027 ($ MILLION)
FIGURE 14 EUROPE PROCESS OIL MARKET, BY PERSONAL CARE,
2019-2027 ($ MILLION)
FIGURE 15 EUROPE PROCESS OIL MARKET, BY TEXTILE,
2019-2027 ($ MILLION)
FIGURE 16 EUROPE PROCESS OIL MARKET, BY OTHER
APPLICATION, 2019-2027 ($ MILLION)
FIGURE 17 THE UNITED KINGDOM PROCESS OIL MARKET,
2019-2027 ($ MILLION)
FIGURE 18 THE UNITED KINGDOM PROCESS OIL MARKET,
2019-2027 (KILOTONS)
FIGURE 19 THE UNITED KINGDOM MOTOR VEHICLE PRODUCTION
2016-2018 (MILLION)
FIGURE 20 ITALY PROCESS OIL MARKET, 2019-2027 ($
MILLION)
FIGURE 21 ITALY PROCESS OIL MARKET, 2019-2027
(KILOTONS)
FIGURE 22 GERMANY PROCESS OIL MARKET, 2019-2027 ($
MILLION)
FIGURE 23 GERMANY PROCESS OIL MARKET, 2019-2027
(KILOTONS)
FIGURE 24 FRANCE PROCESS OIL MARKET, 2019-2027 ($
MILLION)
FIGURE 25 FRANCE PROCESS OIL MARKET, 2019-2027
(KILOTONS)
FIGURE 26 SPAIN PROCESS OIL MARKET, 2019-2027 ($
MILLION)
FIGURE 27 SPAIN PROCESS OIL MARKET, 2019-2027
(KILOTONS)
FIGURE 28 RUSSIA PROCESS OIL MARKET, 2019-2027 ($
MILLION)
FIGURE 29 RUSSIA PROCESS OIL MARKET, 2019-2027
(KILOTONS)
FIGURE 30 REST OF EUROPE PROCESS OIL MARKET, 2019-2027
($ MILLION)
FIGURE 31 REST OF EUROPE PROCESS OIL MARKET, 2019-2027
(KILOTONS)